Homicide Victimization Rate in Relation to
Household Gun Ownership
Hokyou Lee and Jeanie Kim
Stat 133 Assignment #3 (s133bvbz)
Deconstruction
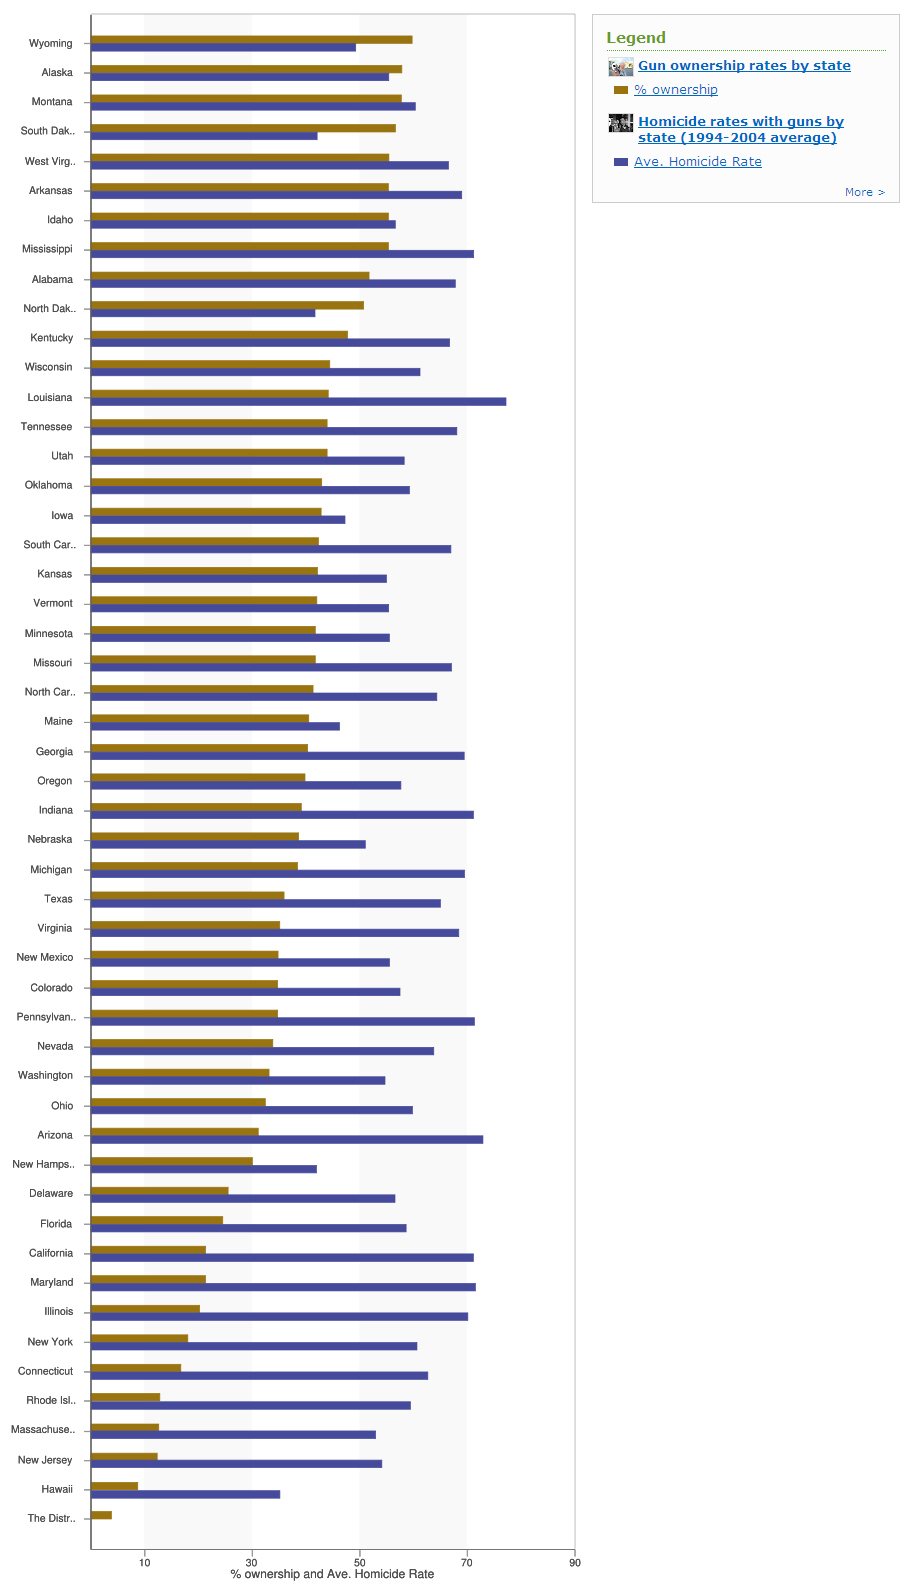
Figure 1. Gun Ownership and Homicide Rate by State
This figure was taken from Swivel -- http://www.swivel.com/graphs/show/8137689
Data
There are two sets of data combined together in this chart. The first set of data (in tan bars) represents the percentage of gun ownership by state in 2001, and the other set (in blue bars) represents the homicide rate by state averaged from 1994 to 2004. These data come from Behavioral Risk Factor Surveillance System and Bureau of Justice Statistics.
Plot Description
This is a (horizontal) bar plot. The catagories in the y-axis are the 51 states (including D.C.) of the United States, and they are sorted in order of decreasing gun ownership. The width of each tan bar corresponds to the percentage of gun ownership, and the blue bar corresponds to the average homicide rate of that particular state. These two bars share the same x-axis (and the same scale), thus for gun ownership the unit is percentage (%), but as for homicide rates the unit is not very clear (this issue will be discussed later).
Message
The message is in fact very unclear in this plot. The user who had posted this plot to Swivel commented, "Seems that most of the time gun ownership is either not correlated or negatively correlated with homicides by gun rates." The "negatively correlated" part of this comment does not sound very persuasive, but otherwise, it is noticeable that this plot is trying to carry a message that homicide rate is not significantly correlated with gun ownership.
Reconstruction
Points to Improve
1. The plot in figure 1 is extremely hard to grasp in one sight. This problem is due to the long list of state names in the y-axis, which is rather a trivial information. The focus should be on the correlation between homicide rate and gun ownership, rather than the names of all 51 states or the order of states by homicide rate, but the nature of bar plot forces one of the axes to hold this list of states. So, this leads to the next point.
2. A scatter plot is preferred to a bar plot in this case, and each variable should have its own axis.
3. The labels are not very informative. First, the percentage of gun ownership is an ambiguous term: is it out of entire population, adult population, or number of households? Second, homicide rate is an even more ambiguous term if no unit is given. Based on the raw data from Bureau of Justice Statistics, homicide rate (as well as all the other crime rates) is in victims per 100,000 population, and these numbers are smaller than the numbers shown in figure 1. Being unsure of what these large numbers mean, we imported the original homicide rates from Bureau of Justice Statistics for the year 2001, matching the year of gun ownership data.
4. District of Columbia (D.C.) lacks the blue bar not because the homicide rate is zero, but because it lacks the value in the data set. This is very misleading, and it seems as if D.C. really has zero homicide rate. In our scatter plot, we threw out D.C. to prevent any confusion.
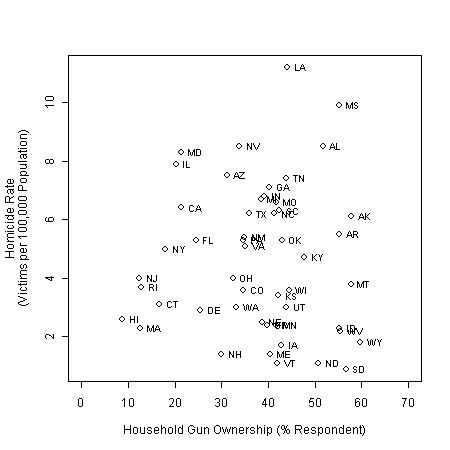
Figure 2. Household Gun Ownership vs Homicide Rate by State
Household Gun Ownership is represented by the percentage of respondents in a survey done by Behavioral Risk Factor Surveillance System in 2001. Homicide rate by state is from Bureau of Justice Statistics 2001. State names are abbreviated into two letters.
Now it is much easier to observe the correlation (if there exists) between gun ownership and homicide rate, and at the same time we can find where a states is (in abbreviation) if needed. In addition, all the information and the message fit in a compact 450 x 450 figure that can be caught in one sight. And most importantly, it is more clear that there exists very little correlation between gun ownership and homicide rate.
More Data, More Correlation
Although we have seen that there exists no significant linear correlation between gun ownership and homicide rate as is, there can be various other contributors to homicide rate other than gun ownership. For instance, states with higher crime rate of other form (e.g. robbery) might also have higher rate of homicide. Other related variables may include population density, per capita income, and so on.
Secondly, we are more interested in homicides in which firearms were used, because it is not so strange to have a low correlation between non-firearm homicide rate and gun ownership. These two points are illustrated in figure 3 below.
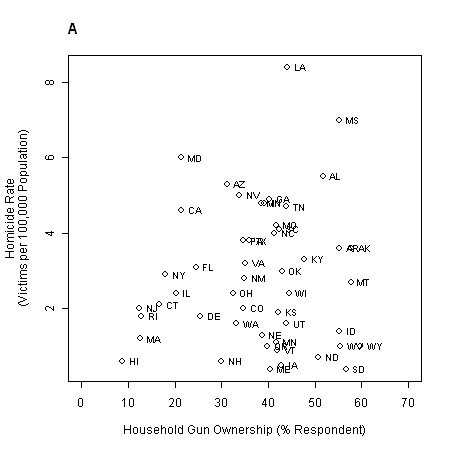
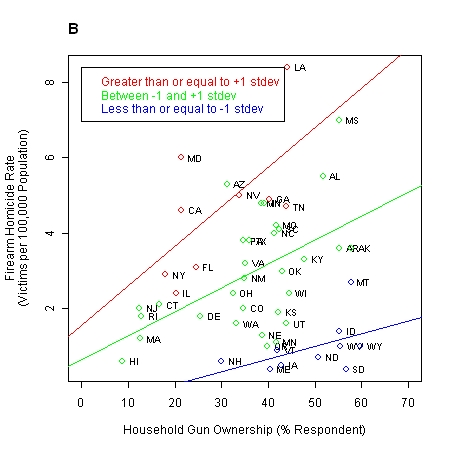
Figure 3. Household Gun Ownership vs Firearm Homicide Rate by State
(A) Homicide rate was converted to firearm homicide rate by multiplying the percentage of homicides in which firearm was used. The weapon types used in homicide are also given by Bureau of Justice Statistics.
(B) The same data was catagorized into three groups by standardized state-level robbery rates: ≤ -1 stdev, between ±1 stdev, and ≥ +1 stdev. The general idea is from a study by Miller et al., 2007. Robbery rate was based on the crime statistics obtained from the same Bureau of Justice Statistics.
The general distribution of states in the plot doesn't look so much different from figure 2, but just by subsetting the data based on standardized robbery rate the correlation between homicide rate and gun ownership becomes more clear than before. This is one evidence that there exists some significant factors other than gun ownership that affects homicide rate, and that by considering these other factors the correlation between gun ownership alone and homicide rate becomes more clear.
Furthermore, we experimented with other variables such as logarithm of population density, per capita income, and robbery rate using Stata 10. We created a multivariate linear regression equation (which we will not go into detail here), and substracted all the other variables * coefficients from homicide rate except gun ownership to isolate the contribution from one variable. This idea is similar to the study by Miller et. al., but we calculated our own equation using Stata. The resulting plots are shown in figure 4 below.
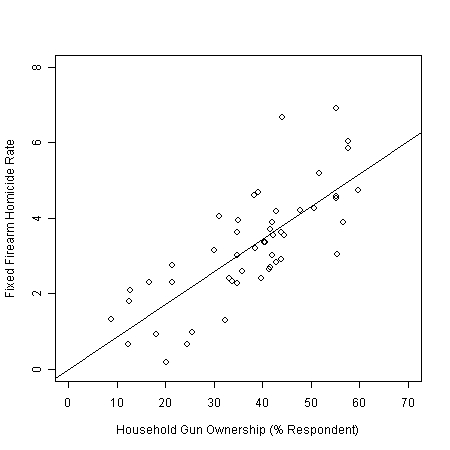
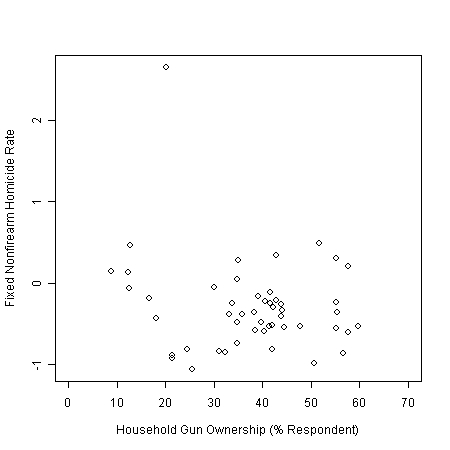
Figure 4. Household Gun Ownership vs Homicide Rate by State after Regression
Other variables come from resources listed below in Reference section. Nonfirearm data was included as a control. We used the logarithm of population density, because population density had a roughly log-normal distribution.
It would be misleading to ignore various other factors that contribute to homicide rates, and to argue that there exists no significant correlation between homicide rate and gun ownership based on simple plots like figures 1 and 2. Incorporating more data and considering more factors can sometimes lead to a different message as in figures 3 and 4. Figure 4 is a more informative plot than the previous plots, because it not only emphasizes the 'firearm-driven' homicides, but it also controls other variables to isolate the influence of gun ownership on firearm homicide rate. And we can clearly see that the nonfirearm homicide rate has a completely different feature.
Reference
Bureau of econommic analysis. (2008). Average income in state-level. Available at: <http://www.bea.gov/regional/spi/drill.cfm>. Accessed Feb. 27, 2008
Bureau of Justice Statistics. (2008). Crime trends. Available at: <http://bjsdata.ojp.usdoj.gov/dataonline/Search/Crime/Crime.cfm>. Accessed Feb. 26, 2008
Bureau of Justice Statistics. (2008). Homicide trends and characteristics. Available at: <http://bjsdata.ojp.usdoj.gov/dataonline/Search/Homicide/Homicide.cfm>. Accessed Feb. 24, 2008
Florida department of law enforcement. (2008). Florida gun crime. Available at: <http://www.fdle.state.fl.us/fsac/Crime_Trends/violent/murder.asp>. Accessed Feb. 27, 2008
Miller, M., Hemenway, D., and Azrael, D. (2007). State-level homicide victimization rates in the US in relation to survey measures of household firearm ownership, 2001-2003. Social Science & Medicine 64 (2007) 656-664. Available at: <http://www.sciencedirect.com/science?_ob=ArticleURL...>.
National Institute on Alcohol Abuse and Alcoholism. (2008). Alcohol consumption in state-level. Available at: <http://www.niaaa.nih.gov/Resources/DatabaseResources/QuickFacts/AlcoholSales/consum02.htm>. Accessed Feb. 27, 2008
Swivel. (2008). Gun Ownership and Homicide Rate by State. Available at: <http://www.swivel.com/graphs/show/8137689>. Accessed Feb. 24, 2008
Washington Post. (2008). Gun Ownership by state. Available at: <http://www.washingtonpost.com/wp-srv/health/interactives/guns/ownership.html>. Accessed Feb. 24, 2008