Professor Sam Wang's amazingly useful site, http://election.princeton.edu/ aggregates poll data to generate a probability distribution of all possible electoral outcomes. In addition, it provides a meta-margin: the amount of uniform statewide swing necessary to change the outcome of the election. And finally, it generates graphs based on that data. I encourage everyone to go and check it out -- unlike some sites, the methodology is entirely open.
Unfortunately, the time-series graph on the website only displays the median electoral vote for each day, rather than the meta-margin. In many ways, tracking the meta-margin provides interesting information that isn't reflected in the median EV tracker, like changes in popular support that don't actually cause any state to flip.
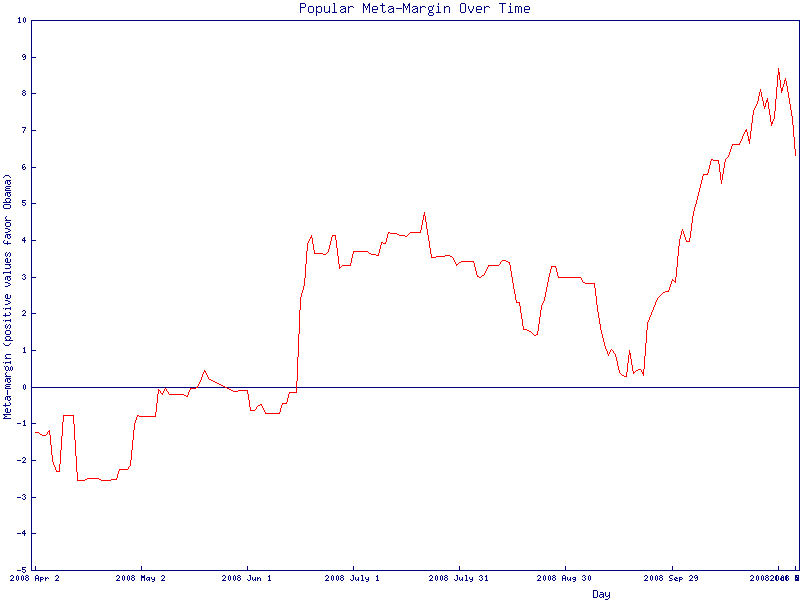
Below is a graph I generate daily using a cronjob. It updates at 12:10 am every day. (I set it at 12:10 because Professor Wang's website runs the update scripts at midnight, and I wanted to give it time to run. Then I realized he's three hours ahead, so it doesn't matter.) The script used to generate the graph can be found here.