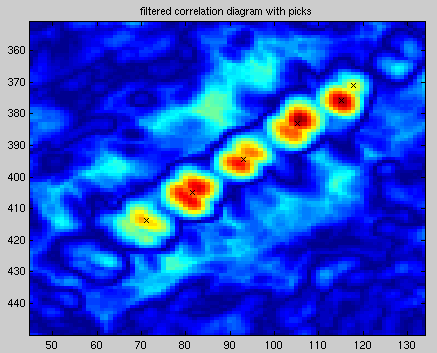
There is a problem with the peak finding. In the (filtered) cross-correlation diagram, the correlation peaks tend to come in pairs, as seen below. Sometimes the two peaks in the pair are separated when the threshold is applied; othertimes they are kept together. When separated, they result in two picks with opposite polarity. When kept together, the pick is made at the "center of mass," approximately midway between the two peaks. A hill-climbing algorithm could be applied to find the actual peaks, but it would be better to have a more robust local-maxima-finding algorithm.
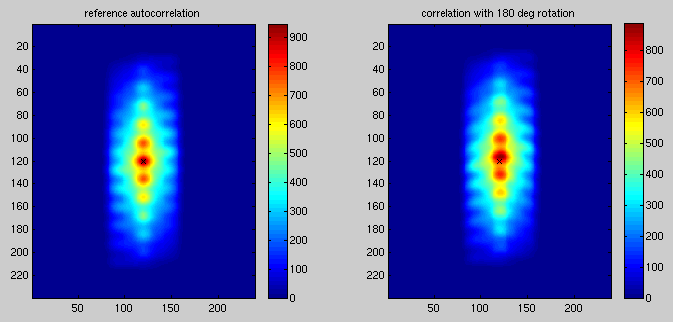
The reason for the double peaks is easily explained; the reference image tends to match itself when rotated 180° and displaced slightly. This can be seen in the correlation diagram between the reference and itself rotated 180°. The image on the left below is the reference's autocorrelation diagram, and the image on the right is the correlation between the reference and a 180° rotation. (The x marks the point of zero displacement.)
ref = rescale(ref);
subplot(1,2,1), imagesc(xcorr2(ref)), title('reference autocorrelation'), colorbar;
hold on, plot([120],[120],'kx'), hold off;

subplot(1,2,2),imagesc(xcorr2(ref,rot90(ref,2))), title('correlation with 180 deg rotation'),colorbar;
hold on, plot([120 120],'kx'), hold off;
Note that in the correlation between the reference and its 180° rotation, the global maximum is ~4.12 pixels from the origin. This corresponds well with the separation between the two peaks in a pair.
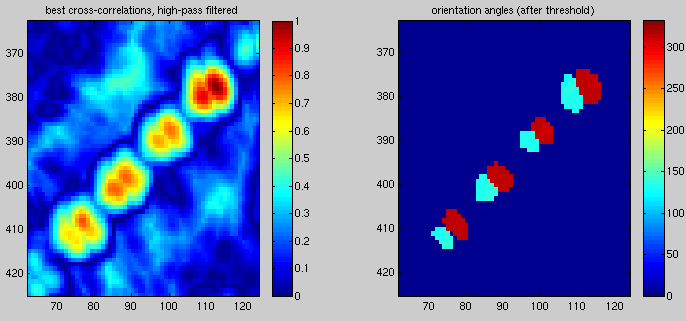
Just in case you're not yet totally convinced, we can look at the orientation angles that resulted in the peaks in the cross-correlation diagram. We see vividly that the secondary peaks are a result of correlation in the opposite direction:
This illustrates another, more general, effect: the autocorrelation represents in some sense the "filter response" of finding an exact match (in a very similar sense as "array response" in the case of seismic arrays). It might be worth trying to deconvolve the response function from the correlation diagram.
to-do: add a screenshot of the fixed peak-finding