
Making the Case Against Preemption of Inclusionary Zoning: The Case of Nashville
Introduction
We Need Affordable Housing Now. Renters across the nation are facing one of the worst affordable housing crisis in decades and the precariousness of many renters’ housing situations continues to grow. As of 2015, 8.3 million low-income households are renting in the private market without any housing assistance and are extremely rent burdened, lack adequate housing, or both.[1] The number of these vulnerable, renter households has grown 66 percent since 2001, and 44 percent of that growth has occurred since the Great Recession.[2] A survey of tenants found that a third of those evicted through the courts paid 80 percent of their incomes on rent, and a vast majority, 92 percent, were evicted due to falling behind on rent.[3] Due to such massive housing cost burden, it does not take a major event for a household to become displaced and destabilized, but rather simple life expenses or minor financial setbacks.
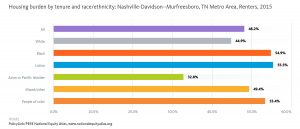
Nashville is no exception. Although housing units only increased by 5 percent between 2005-2015, population growth increased by 24 percent within that same time period.[4] 60 percent of this new development was single-family homes, which are mostly for sale rather than for rent – excluding Nashville residents that lack the financial resources to obtain a mortgage. A third of all Davidson County residents, or 203,7000 people, are unable to afford housing. Almost half of all renters are cost burdened, while 82 percent of extremely low income (households earning less than a third of Nashville’s area median income, AMI) and 72 percent of low-income renters (households earning 31-50% AMI) are cost burdened. While rents have increased by 56 percent, wages have only increased by 8 percent.[5] Although wages in the aggregate have increased, this is not the case for all Nashville residents. Additionally, real wages have remained stagnant and have decreased for Nashville’s residents of color, who also suffer the highest housing cost burdens, putting them in a vulnerable position (graphs below).
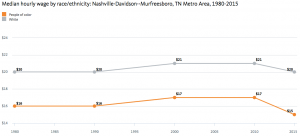
Source: PolicyLink National Equity Atlas, PUMS
Funding to build affordable housing is shrinking. In a time where renters are in crucial need of housing assistance, fewer are receiving it. The last decade has been marked by a shrinking Housing and Urban Development (HUD) budget. Between fiscal years 2010-2018, HUD’s budget has contracted by a third in 6 out of its 8 key programs, affecting the Community Development Fund, subsidies for persons with disabilities, public housing subsidies, and Section 8 Housing Choice Vouchers.[6] For the fiscal year 2019, the federal administration has proposed the largest budget cut HUD has seen in three decades, a total of $8.8 billion that would eliminate housing vouchers for more than 250,000 households.[7] Although HUD had modestly increased funding for project-based rental assistance, a program that contracts with private owners to subsidize affordable rental costs to low-income households, it has been overshadowed by the nation’s enormous growth in need. Between 2003 to 2016, households receiving HUD subsidies increased from 4 million in 2003 to 4.6 million in 2016. However, the number of low-income households receiving HUD assistance declined as a share of all cost-burdened renters, from 24 percent in 2005 to 21 percent in 2015.[8]
Affordability gains made throughout the 1980s and 1990s is at risk, as more than half a million units constructed using Low Income Housing Tax Credits, Project Based Section 8 Rental Assistance contracts, and HUD Section 202 and 811 properties for elderly and people with disabilities will expire within the next five years.[9] Between 2000-2015, Nashville has lost a fifth of all affordable units, totaling 18,000 units, the largest contraction the city has experienced. To compound the problem, 60 percent of the city’s subsidized and public housing units will expire by 2025. Since the Low-Income Housing Tax Credit and Section 8 funding depend on federal financing, these programs are contingent upon the funding priorities of each administration.
Background
Inclusionary Zoning within Housing Policy. Due to the shrinking federal appropriations dedicated to local affordable housing programs, cities have been increasingly relying on the private market to deliver affordable housing production. Although cities administer a few housing programs from state and federal funding sources, the creation and implementation of a majority of housing policies occur at the discretion and experimentation of legislative bodies, public and private organizations, and citizen groups and residents. Inclusionary zoning, a policy that requires developers building a minimum number of units to provide a certain percentage of affordable units, incorporates affordable housing development within the building cycles of the market and is especially robust in cities with a high level of development activity. Inclusionary housing is adopted and implemented exclusively at the local level. However, many states have adopted statutes that nullify and preemption local inclusionary zoning ordinances, either explicitly so or by using rent control preemption to interpret inclusionary zoning as a taking on private property.
Nashville’s Preemption of Inclusionary Zoning. The Tennessee state legislature has preempted many local policies that hope to advance racial and economic justice, including inclusionary zoning, local minimum wage increases, local hire, and anti-discrimination protections. By doing so, the state essentially nullifies local policymaking power and limits the tools available for localities to respond to the needs of their residents. Nashville’s Housing Incentives Pilot Program, a voluntary inclusionary zoning policy, was watered down after pressure from the developers and Tennessee’s preemption on mandatory inclusionary zoning.[10] The program set aside a budget of $2 million to grant to developers to incentivize affordable and workforce housing. This program is entirely voluntary, and developers can opt in at their own discretion, where they receive incentives such as zoning variances in exchange for a certain number of affordable units. However, Mayor Barry has proposed to divert $1.5 million of the $2 million for Nashville’s struggling General Hospital.[11] Additionally, the Tennessee state legislature preempted this voluntary program because requiring developers to build and rent out units any lower than market rates is imposing a “price control”. Thus, the only way that the City can induce affordable development from the private market is through direct subsidies, similar to Section 8 Housing Choice Vouchers that make up the difference between rent affordable at a certain income level and market-rate rents. The primary method affordable housing in Nashville is built is through affordable housing nonprofit developers, who are provided with funding from the Barnes fund. As to date, the City of Nashville has not been able to induce or leverage any affordable housing from private developers through inclusionary zoning. A community benefits agreement has been reached with Soccer Stadium Holdings, who agreed to provide (percent). However, rather than triggering affordable housing within market rate development, which inclusionary zoning would do.
Data Sources
I have used three primary data sources
Demographic data and race for the entire state of Tennessee are from the U.S. Census Bureau’s American Community Survey 5-year Estimates from 2012-2016 and the Decennial Census from 2000 using the Census Bureau’s API.
Eviction data is from Matthew Desmond’s Eviction Lab at Princeton University, which is the first nationwide data on court filed evictions between the years of 2000-2016. This data is great but is undercounted as it is a huge challenge to collect eviction data. For example, it does not capture soft evictions, such as tenants that face intimidation, while a few years in Nashville are missing data.
Data on Nashville’s development trends is from Nashville Open Data Portal.
Methodology
I pulled all of the demographic data using the Census Bureau’s API and cleaned and processed the data using pandas. I used matplotlib and seaborn to visualize graphs and scatterplots. In addition, I used geopandas to conduct spatial joins and created geojsons to merge my tabular data with my spatial data.
Race and Ethnicity
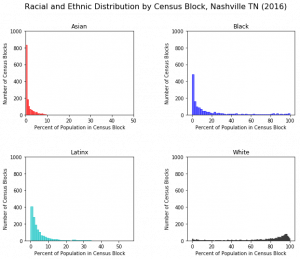
In Nashville, it seems that there are a larger number of census tracts where residents are predominately white. As shown by the last histogram, there is a large number of census tracts where the population is 80% to 100% white. Since the white population in Nashville is 62%, this suggests that these neighborhoods are racially segregated. Whereas the narrative and term of racial segregation are only used to describe people of color, white neighborhoods are often the most racially segregated and exclusionary.
On the other hand, many Nashville census tracts have virtually no Asian, Latinx, and Black residents. It seems that there is not a presence of racially concentrated neighborhoods of Asian and Latinx residents in Nashville. This may be due to the fact that Asian and Latinx make up a smaller share of Nashville’s population, although this in itself does not necessarily mean there will be little segregation. Considering that the Asian and Latinx population comprise of 3% and 10% of Nashville’s total population, respectively, we can see that there are census tracts where these groups are overrepresented. Although a slightly similar trend is true for Nashville’s African American residents, there is a greater number of census tracts that are predominately African American, who make up a third of Nashville’s population. A greater historical and qualitative inquiry should be made, as many of these neighborhoods boast Nashville’s historically strong Black middle class.
Nashville Housing Vulnerability Indicators
Housing cost burden is the most severe within Nashville’s core, Northeast and Southwest periphery, overlapping neighborhoods with a high share of residents of color. The reddest census tracts are areas where more than half of renters pay more than a third of their income towards rent. This cost burdened is contrasted with Nashville’s suburban ring, where very few renters are cost burdened. At the state level, an average of 42% of renters is cost burdened. This number in of itself is high, but when we examine Nashville, many more of the City’s its renters are worse off due to the vast increases in rent.
Nashville has experienced vast increases in rent compared to the state of Tennessee as a whole. From 2000 to 2016, the state of Tennessee saw rents increase by 10%. As shown by the map below, large swaths of Nashville have experienced rent increases at an accelerated rate compared to the state as a whole. Many census tracts in Nashville’s core and periphery have doubled. As Nashville is one of the largest metropolitan areas, the cost of living historically and will likely always be more expensive than more rural areas of the state, where residents earn lower incomes. While metropolitan areas are experiencing a growth in rental prices, inclusionary zoning preemption stunts the production of affordable housing, effectively channeling those that are the least able to shoulder these rental price increases into the private market, one which has drastically become costlier since 2000.
Evictions in the State of Tennessee
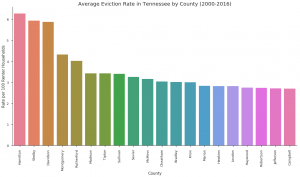
The three counties with the highest eviction rates, Hamilton, Shelby, and Davidson counties, have the highest cost of living in the state of Tennessee. These metropolitan areas also are the most populous and house the most diverse population and the largest presence of people of color. When the state legislature preempts affordable housing in metropolitan areas that have the strongest housing markets, it is disproportionately harming residents of color. When these counties experience eviction rates twice that compared to the state average, barring localities to adopt inclusionary zoning ensures renters are faced with greater affordability challenges and a higher likelihood of an eviction event.
Evictions in Nashville
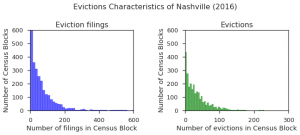
In Nashville, far more evictions are filed compared to the number of evictions that are ordered by a court because multiple eviction filings can be brought upon one renter household. For example, a family living in one housing unit may be served with three evictions, resulting in an eviction filing rate of 300%. In 2016, there was a significant number of census tracts where as many as 100 to 200 eviction filings occurred. Although this case is the minority, a few census tracts have even seen upwards of 4oo eviction filings within a year.
In 2016, of the top 20 census tracts with the highest eviction rate, 11 of those also had the highest share of African American residents. In Tennesse, 2.8% of all renter households experienced a court-ordered eviction. The census tracts that house a higher than average eviction rate are shown in medium to dark pink. These census tracts overlap with areas that have the highest population of people of color. (For this data, please refer to the housing vulnerability map).
Eviction Correlations

Evictions in Nashville during 2016 are not closely related to poverty rate and effect renters of all income levels. This may possibly be because the poverty rate threshold may be misleading in expensive cities. Since Nashville is the most expensive city in Tennessee, those that are not considered living under the poverty rate may still face housing insecurity. Additionally, since rents have accelerated as such a fast pace in Nashville, many middle-income renters may find themselves squeezed by the rapidly rising rents. For next steps, I would conduct a correlation and regression with income and eviction, rather than poverty rate.

Evictions in Nashville grow with higher rents and seem to peak once median gross rents reach approximately $800. After this “threshold”, eviction occurrences decrease, possibly because renters paying higher rents are able to afford higher market rate rents and are less cost burdened. It seems that between $600-$800 is the range of rent that may force a household into the possibility of increased eviction vulnerability. It would be interesting to assess neighborhoods where rents have grown to this rate and examine other historical trends.
Nashville Residential Development Trends
As Nashville has experienced a building boom, yet the City has an enormous shortage of affordable homes, compounded by a record loss of affordable units while affordable housing production has stalled. Popular rhetoric surrounding the growing housing affordability problem across the country is that increased development will push prices down through a “trickle down” effect.
However, the areas with the most development in Nashville also have the largest number of vacancies and overcrowding. In other words, areas with the most housing production are not areas that require this development. This development is either unable to sell or builders are profiting from a market of seasonal and/or second homes. As Nashville is one of the county’s largest tourist destinations, investors may also be buying properties as short-term rentals to capitalize on the revenue that tourists provide. What is clear is that accelerated development is not being occupied when thousands of Nashville’s residents are facing precarious housing situations.
The same year that the Tennessee legislature preempted inclusionary zoning, Nashville saw a surge in new residential construction, occurring within communities of predominately people of color. Development has slowed in 2017 and picked up slightly in 2018. Within these past three years, the city has introduced approximately 1,000 new residential developments. When new development occurs without any affordable units, this puts renters at risk of displacement. While Nashville had a surplus of approximately 2,000 units of affordable housing in 2000, the City currently has a deficit of 18,000 units [12]. Even amidst a building boom, there exists a mismatch between housing development and housing need. When inclusionary zoning is prohibited, Nashville’s loss in both subsidized and unsubsidized affordable housing will be lost forever, leaving the city with few tools to provide cost burdened residents with stabilization and security.
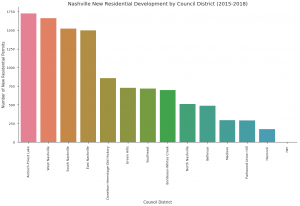
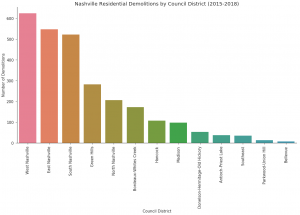
I created these two bar graphs to contextualize which neighborhoods are experiencing the most development to complement qualitative research I am conducting that gives more of a story to these areas that census tracts do not lend well to. The lived experiences of many East Nashville residents is one of rapid gentrification and displacement. These bar graphs show that East Nashville is experiencing high levels of development, but also the second most demolitions, suggesting that existing structures are being torn down to make way for new development. Since East Nashville has been an area of historically middle-class Black neighborhoods, this new development is contributing to the displacement of longtime residents and families that have been pressured to sell their homes to make way for luxury development. Since inclusionary housing is preempted, the city has few tools to capture development to stem displacement – even though inclusionary zoning itself is not enough to meet both the need for affordable housing and the displacement residents are experiencing.
Sources:
[1] Low income is defined as those earning 50% or less of the Area Median Income (AMI), adjusted for household size. In 2015, the national median income for a family of four was $66,700. Extremely rent burdened is defined as a household paying greater than half of their income towards rent. “WORST CASE HOUSING NEEDS 2017 REPORT TO CONGRESS | HUD USER.” n.d. Accessed July 17, 2018. https://www.huduser.gov/portal/publications/Worst-Case-Housing-Needs.html.;
[2] “WORST CASE HOUSING NEEDS 2017 REPORT TO CONGRESS | HUD USER.” n.d. Accessed July 17, 2018. https://www.huduser.gov/portal/publications/Worst-Case-Housing-Needs.html.; ACS 1 year estimates 2015 table B25070
[3] Desmond, Matthew, Weihua An, Richelle Winkler, and Thomas Ferriss. 2013. “Evicting Children” Social Forces, no. Issue 1: 303.
[4] https://www.nashville.gov/Portals/0/SiteContent/MayorsOffice/AffordableHousing/Housing%20Nashville%20FINAL.pdf
[5] https://www.rentjungle.com/average-rent-in-nashville-rent-trends/
[6] National Low Income Housing Coalition. 2018. “Out of Reach The High Cost of Housing 2018.” OUT OF REACH, 284.
[7] “WORST CASE HOUSING NEEDS 2017 REPORT TO CONGRESS | HUD USER.” n.d. Accessed July 17, 2018. https://www.huduser.gov/portal/publications/Worst-Case-Housing-Needs.html.;
[8] Kingsley, G. Thomas. 2017. “Trends in Housing Problems and Federal Housing Assistance.” Urban Institute. https://www.urban.org/research/publication/trends-housing-problems-and-federal-housing-assistance.
[10] Ibid
[11] Mandatory inclusionary zoning is when city ordinance stipulates that all development that falls under a certain category, such as multifamily development with 5 units and above, include a certain percentage of affordable housing. It can be mandatory or voluntary.
[12] https://www.tennessean.com/story/news/politics/2018/01/31/nashville-new-affordable-housing-policies-slow-out-gate-now-face-budget-slash/1074878001/
[13] Data from Nashville Open Data Portal on building permits of new residential construction: 593 in 2016, 280 in 2017, and 325 in 2018