Hypnotizability is factorially complex, raising the possibility that there may be different types of hypnotizable subjects, possessing different profiles of hypnotic abilities. A reanalysis of standardization data from the Stanford Profile Scales of Hypnotic Susceptibility, Forms I and II (N = 155) by hierarchical cluster analysis identified 12 distinct patterns of performance, accounting for 93.9% of the cases. These clusters were not artifacts of the difficulty levels of the scale items, but seem to represent widely shared combinations of component abilities within the general domain of hypnosis. Analysis of the patterns suggests at least three such component abilities: ideomotor action, imagery, and dissociation. Further, the imagery and dissociation components may be classified by the primary cognitive mode involved, perception or memory. Detailed analyses of criterion measures of hypnotic susceptibility serves as an important first step in generating and testing hypotheses concerning the cognitive correlates of hypnotic susceptibility.
One of the cardinal features of hypnosis is the presence of substantial individual differences in hypnotizability. Measurement of the person's "talent" for hypnosis may be accomplished by any of a variety of standardized performance tests or work-samples, which consist of an induction of hypnosis accompanied by suggestions for a representative set of hypnotic experiences. From the results of these scales it appears that the distribution of hypnotic susceptibility in the population is quasinormal (with a hint of bimodality: see Balthazard & Woody, 1986; Hilgard, 1965), with few hypnotic "virtuosos" who can respond to all (or virtually all) hypnotic suggestions that are offered to them, and few individuals who are largely or entirely refractory to hypnosis (E. Hilgard, 1965, 1977; Kihlstrom, 1985a).
In studying individual differences in hypnotic susceptibility and their correlates among other features of personality, investigators have typically quantified hypnotizability with a single sum score, thus implying that the construct is unidimensional. In fact, all of the items of the Stanford and Harvard scales are positively correlated, so that a fairly strong common factor runs through them. Nevertheless, factor-analytic studies also reveal some heterogeneity among the items (for reviews, see Balthazard & Woody, 1985; Tellegen, 1978-1979).
The identification of specific hypnotizability factors and the informal observation that even highly hypnotizable individuals do not necessarily respond positively to all hypnotic suggestions led to the development of the Stanford Profile Scales of Hypnotic Susceptibility, Forms I and II (SPSHS:I and II; E. Hilgard, Lauer, & Morgan, 1963; Weitzenhoffer & E. Hilgard, 1963, 1967). These advanced scales, primarily consisting of difficult suggestions for cognitive alterations, are intended to be used in conjunction with more elementary scales to assess subjects' abilities in six separate areas of hypnosis: agnosia and other cognitive distortions; positive hallucinations; negative hallucinations; dreams and regressions; amnesia and posthypnotic compulsion; and loss of motor control. Although a subject's hypnotizability can be indexed by means of a single sum score, the pattern of strengths and weaknesses indicated by performance on these six subscales comprises a profile of hypnotic abilities, analogous to profiles derived from the subscales of the Wechsler Adult Intelligence Scale or the Minnesota Multiphasic Personality Inventory. Classification of such profiles is one step toward the development of empirically based taxonomies of people with respect to both wide and narrow domains of personality (Block & Ozer, 1982; Mendelsohn, Weiss, & Feimer, 1982).
E. Hilgard (1965) presented a preliminary classification of the SPSHS profiles into nondeviating profiles, those deviating on one subscale only, and those deviating in two or more subscales. The deviating profiles were further classified in terms of the specific subscales showing peaks and valleys. While this coding procedure yielded a large number of apparently different profiles, the statistical procedures available at the time did not indicate the degree to which any individual's pattern of hypnotic assets and liabilities was shared with others in the population. The present study employed hierarchical cluster analysis (Aldenderfer & Blashfield, 1984) to uncover any patterns of hypnotic abilities that might be shared among hypnotizable individuals, and to determine the relations of these patterns to overall level of hypnotic abilities. Thus, the study is partly person-centered, an attempt to determine whether there are distinct "types" of hypnotizable individuals. However, the research was also variable-centered, in that the composition of any shared patterns may suggest what cognitive skills underlie the ability to experience hypnosis.
This study involved an analysis of data obtained in 1963-1965 during the standardization of the revised SPSHS (Weitzenhoffer & E. Hilgard, 1967). The sample consisted of 155 Stanford University students (85 women and 70 men) drawn from an original pool of 374 who had achieved scores of 4 or more on the 12-point SHSS:A, and who were thus considered to be at least somewhat hypnotizable. After receiving SHSS:A, the subjects completed SHSS:C and finally SPSHS:I and II. The subjects participated in a total of 5 hours of individual hypnotic assessment. To our knowledge, this is the only substantial body of SPSHS data in existence.
The profiles examined were composed of six subscale scores, corresponding to the six areas of hypnotic ability assessed by the SPSHS, as designated intuitively and largely confirmed by factor analysis (Lauer, 1965). The individual items comprising the subscales consisted of suggestions for reality distortion that were administered to subjects after they received a standardized hypnotic induction. Scores for amnesia, posthypnotic compulsion, and motor control items were derived by pooling relevant items from SHSS:A and SHSS:C, as these domains are not represented on SPSHS itself.1 Scores for agnosia and cognitive distortion, positive and negative hallucinations, and dreams and regressions were provided by SPSHS:I and II.
Table 1 shows the composition of each of the six subscales. Scale MC consists of four independent sets of ideomotor and challenge suggestions from SHSS:A and SHSS:C: all represent some degree of loss of volitional control over motor action. Scale DR consists of suggestions for hypnotic dreams, age regression, and hypermnesia. Scale AG consists of suggestions for distortion in semantic and procedural knowledge, and for alterations in self-perception. The items in scales HN and HP call for alterations in sensation and perception: negative hallucinations (HN), the lack of awareness of normally perceptible stimulation; and positive hallucinations (HP), the sensory-perceptual experiences occurring in the absence of appropriate environmental stimuli. Finally, Scale AM consists of the posthypnotic amnesia items from SHSS:A and SHSS:C, plus SPSHS items calling for posthypnotic responses with accompanying amnesia. Each subscale was composed of four items, and each item was scored on a 0-3 scale on the basis of well-specified behavioral criteria. Thus, raw subscale scores ranged from 0-12.
Table 1Item Content of SPSHS:I/II Subscales |
|||
Subscale |
Content |
Source |
items |
MC |
Loss of Motor Control | SHSS:A
SHSS:A SHSS:A/C SHSS:A/C |
Motor Pool 1
Motor Pool 2 Motor Pool 3 Motor Pool 4 |
DR |
Dreams and Regressions | I :04
I :06 II:04 II:06 |
Recall Meal
Unspecified Dream Age Regression Dream about Hypnosis |
AG |
Agnosia and Cognitive Distortion | I :07
I :08 II:07 II:08 |
Meaning: House
Arithmetic Impairment Meaning: Scissors Reduced Intelligence |
HN |
Negative Hallucinations | I :01
I :03 II:02 II:05 |
Analgesia to Shock
Anosmia to Ammonia Selective Deafness Selective Blindness |
HP |
Positive Hallucinations | I :02
I :05 II:01 II:03 |
Music
Light Heat Smell Ammonia |
AM |
Amnesia and Posthypnotic Suggestions | I :09
II:09 SHSS:A SHSS:C |
Verbal Compulsion
Automatic Writing Amnesia Amnesia |
The raw scores for each subscale were standardized to have a mean of 50 and a standard deviation of 10. The raw subscale scores in each profile were converted to their standard score equivalents, and subsequent analyses were based on the resulting standard score profiles. The use of standard scores insured that each subscale had an equal weight in the calculation of profile similarities.
The major goal of this study was to determine whether there are groups of hypnotizable subjects who share similar profiles of assets and liabilities within the domain of hypnosis, as represented by their scores on the subscales of SPSHS. Profiles of subscale scores contain three types of information about a person's performance: (a) level, defined as the mean of the person's subscale scores; (b) scatter, defined as the variability of the subscale scores about their mean; and (c) shape, defined as the direction of the deviations of the subscale scores from their means. Profiles can thus be similar to one another in terms of level, scatter, shape, or combinations of these attributes.
The choice of a measure of profile similarity depends on which attributes are deemed theoretically relevant. In the present analysis both shape and scatter were considered important because of the focus of the investigation on differential abilities. Level information, on the other hand, was considered irrelevant because the goal was to discover patterns of abilities that were independent of level. Information about profile level was eliminated from the index of interprofile distance by calculating the deviation of each subscale score from the subject's mean subscale score. Interprofile distances were then calculated for every pair of deviation-score profiles in the sample.
Interprofile distance (Cronbach & Gleser, 1953; Osgood & Suci, 1952; Skinner, 1978) was chosen as the measure of profile similarity because it allows scatter and shape to be represented independently of level. In the present case, the interprofile distance between two profiles may be interpreted as the Euclidean distance between two points representing those profiles in a six-dimensional space. Because interprofile distance is actually a measure of dissimilarity, low values indicate a high degree of similarity between profiles.
Subjects who perform at approximately the same level on all six of the subscales of SPSHS exhibit essentially flat profiles. Such subjects do not show any pattern of hypnotic assets and liabilities -- they are equally skilled, or unskilled, at all types of hypnotic suggestions. Therefore, it seemed appropriate to exclude as many such subjects as possible from the cluster analysis at the outset. A total of 28 profiles (18% of the sample) with scatter values more than 1 SD below the mean scatter (M = 15.09) for the entire sample of 155 profiles were classified as flat. These profiles were excluded from consideration because they did not indicate any differential hypnotic abilities. After exclusion of these subjects, 127 profiles remained available for cluster analysis.
Non-metric hierarchical cluster analysis (Johnson, 1967) was applied to the interprofile distances of these remaining 127 profiles. The computer program employed for this purpose, AGCLUS (Olivier, 1973), employed the maximum (or complete link) method (Johnson, 1967).2 The maximum method begins by considering each subject as a separate cluster, and then groups clusters together according to profile similarity. A cluster is added to an existing cluster only when it is more similar to all members of the cluster than it is to all members of any other cluster. Of the many clustering methods available (Aldenderfer & Blashfield, 1984; Anderberg, 1973; Everitt, 1974), the maximum method is generally preferred. Monte Carlo comparisons with other clustering methods (Baker & Hubert, 1975; Blashfield, 1976, 1980; Hubert, 1974; Kuiper & Fisher, 1975) indicate that the maximum method solution generally corresponds more closely with experimenter-determined structures of input data and that it is less sensitive to noise deliberately added to that data. In addition, Anderberg (1973) has reported that the maximum method is most likely to produce homogeneous clusters.
Hypnotic susceptibility is quasinormally distributed in the general population. However, examination of the distribution of total SHSS:A scores for the 155 subjects employed in this study revealed a nearly rectangular shape. In addition, the distribution of SHSS:C scores was skewed toward the upper end of the scale. Although the sample was not representative of all levels of hypnotizability (because it excluded those who are refractory to hypnosis), it was representative of the levels of moderate-to-high hypnotizability for which the issue of differential hypnotic abilities is relevant.
Table 2 presents the sample parameters for the full sample (N = 155) and for the reduced sample (N = 127) employed in the cluster analysis. Comparison of the values for the two samples indicated that removal of the 28 subjects with obviously flat profiles had little effect on the characteristics of the subsample submitted to the cluster analysis. It is important to note that the mean total SHSS:A and SHSS:C scores are somewhat higher than is typically observed in volunteer samples, simply because of the exclusion of subjects scoring less than 4 on the 12-point SHSS:A.
Table 2Hypnotizability of Full Sample and Subsample |
||
Variable |
Full Sample |
Subsample |
N |
155 | 127 |
SHSS:A ScoreMSD |
7.77 2.48 |
7.80 2.40 |
SHSS:C ScoreMSD |
7.19 2.54 |
7.30 2.40 |
Total Profile ScoreMSD |
49.86 7.90 |
49.97 7.10 |
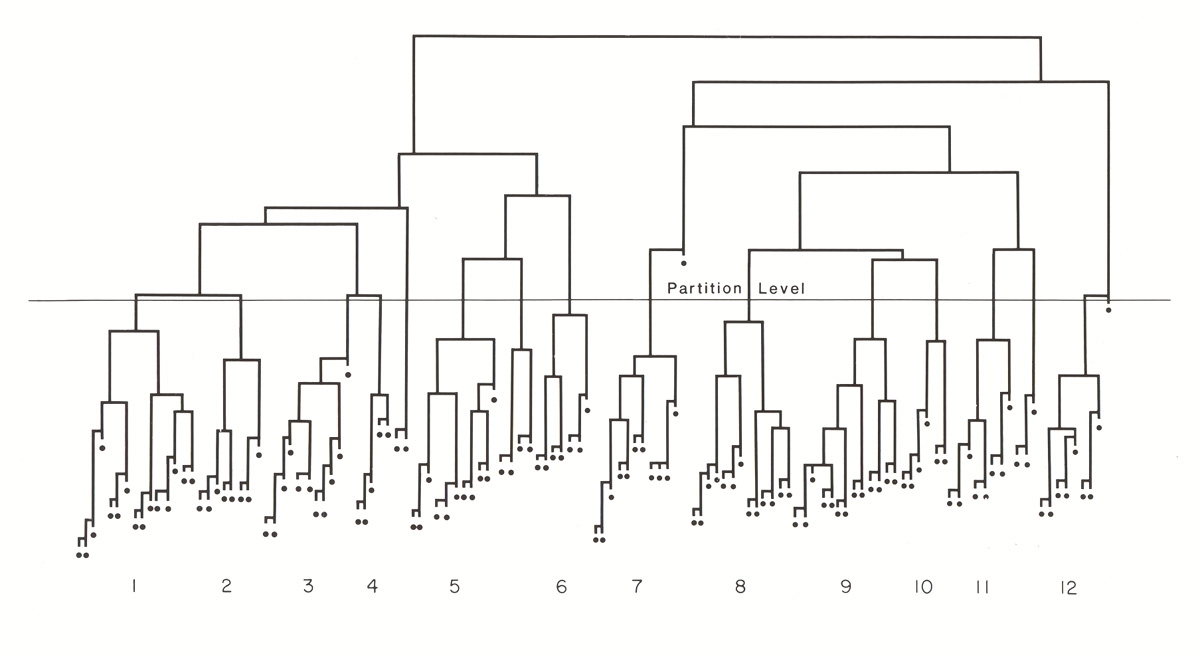
Figure 1 summarizes the output from the cluster analysis. It consists of a tree or dendrogram showing the hierarchical clustering of the profiles and indicates the amalgamation distances at which the various clusters were formed. Amalgamation distance is defined as the minimum similarity between any two objects grouped at a particular level. It is a positive function of the Euclidean distance between adjacent cases, so that large distances reflect highly dissimilar profiles. At the first level of clustering, pairs of cases with the most similar profiles were grouped together to form clusters. At successive levels, additional clusters were joined to form groupings of increasingly large size.
Figure 1. Schematic representation of the maximum method dendrogram summarizing the clustering of 127 profiles of hypnotic abilities. Subjects are arranged horizontally across the bottom, while the lengths of the branches reflect the Euclidean distances between adjacent profiles (or clusters of profiles). Branches crossing the partition level represent the various clusters obtained in this study. The numbers refer to the 12 profiles described in Table 3.
When the purpose of a cluster analysis is to derive a set of discrete clusters by hierarchical clustering, a difficulty arises in deciding how many clusters are present in the data. At one level, maximizing homogeneity within clusters, there were 127 clusters in the sample -- the individual subjects themselves. At another level, minimizing the number of clusters, there was only a single cluster -- the entire batch of subjects. To date, no adequate statistical procedure for solving this problem has been developed (Everitt, 1979). Consequently, a somewhat intuitive -- but conventional -- approach was employed. A cutoff amalgamation distance, or partition level, was chosen on the basis of an examination of the dendrogram for large changes between amalgamation distances (Aldenderfer & Blashfield, 1984; Anderberg, 1973; Everitt, 1974). To facilitate this process the amalgamation distances were arranged in descending order of magnitude, and the differences between these consecutively ordered values were plotted. Large changes in the differences were candidates for the location of the partition. In this way an appropriate partition level was located between amalgamation distances 25.31 and 23.54. This choice achieved an appropriate tradeoff between (a) choosing a low amalgamation value in order to maximize the homogeneity of the clusters; and (b) choosing a high amalgamation value in order to produce clusters large enough to be considered to represent reliable and widely shared patterns.
Partitioning the dendrogram by this method produced 17 separate clusters, indicated by the number of dendrogram branches remaining above the partition level. However, two of these consisted of only single elements (subjects), and three more contained fewer than five elements each. These five clusters, accounting for only 11 cases (8% of the sample), appeared to be too small to represent reliable and widely shared patterns. Application of the maximum method of clustering to the set of 127 cases thus yielded 12 clusters accounting for 91.2% of the cases.2
Table 3 summarizes each of the 12 profiles retained from the cluster analysis. The numbers associated with the profiles represent the order in which they appear in the dendrogram of Figure 1, from left to right, excluding the five small, residual profiles. The number of cases in each cluster ranged from 5 to 15, with an average of 9.67 subjects. As might be expected given the manner in which subjects were selected to receive SPSHS, the average SHSS:C score associated with most profiles is relatively high. The table also gives the mean standard scores for each cluster on the combined SPSHS, providing a measure of overall profile level, and the mean average between the profile level and the individual subscale standard scores, which provides a measure of the scatter of individual profiles around the mean for their cluster. None of the mean profile level scores departed substantially from the average of 49.72.
Table 3Description of SPSHS Clusters |
|||||
Cluster |
N of Cases |
M SHSS:C Score |
M SPSHS Score |
Scatter |
Average Profile Shape |
01 |
15 | 7.40 | 50.97 | 12.59 |
##P#N# |
02 |
8 | 7.90 | 51.79 | 15.98 |
PP#N#N |
03 |
11 | 7.80 | 48.62 | 14.34 |
P##N## |
04 |
5 | 7.00 | 47.13 | 14.77 |
P#N##N |
-- |
2 | ----- | ----- | ------ |
------ |
05 |
11 | 6.20 | 48.88 | 11.80 |
N##P## |
-- |
4 | ----- | ----- | ----- |
------ |
06 |
7 | 6.40 | 48.69 | 15.81 |
NP##P# |
07 |
11 | 7.30 | 47.93 | 16.03 |
NP#N#P |
-- |
1 | ----- | ----- | ----- |
------ |
08 |
13 | 8.10 | 52.42 | 13.38 |
#N###P |
09 |
13 | 7.20 | 48.92 | 6.75 |
###### |
10 |
6 | 5.00 | 46.97 | 14.48 |
#N#P## |
11 |
8 | 8.00 | 55.90 | 14.56 |
###PNP |
-- |
3 | ----- | ----- | ----- |
------ |
12 |
8 | 7.30 | 45.75 | 18.33 |
PN##N# |
-- |
1 | ----- | ----- | ----- |
------ |
| 1Order of scales: MC, DR, AG, HN, HP, AM. | |||||
In addition to measures of profile level and scatter, the shape of each profile was summarized twice, at the level of the individual subject and at the level of the cluster. At the level of the individual subject, a subscale was coded P (for a positive deviation) if its standard score was at least 0.5 SD greater than the mean of all six of that subject's subscale scores; if a subscale score was at least 0.5 SD less than his or her mean subscale score by this amount, it was coded N (for a negative deviation); and if the subscale score was within .5 SD of the mean of the subscale scores, it was coded with a dot (.). Inspection of the individual subject profiles indicated that the method of cluster assignment resulted in relatively homogeneous profiles with respect to these attributes.
At the level of the cluster, the shape of the average profile was obtained in a similar manner, by considering the difference between the average profile level and the average score, within the cluster, on each subscale. For this analysis, the six subscales were required to deviate at least 5 points from the mean profile level for that cluster in order to be coded P or N. Table 3 gives summary of the shape of each profile. (The remaining column of Table 3 is discussed below.)
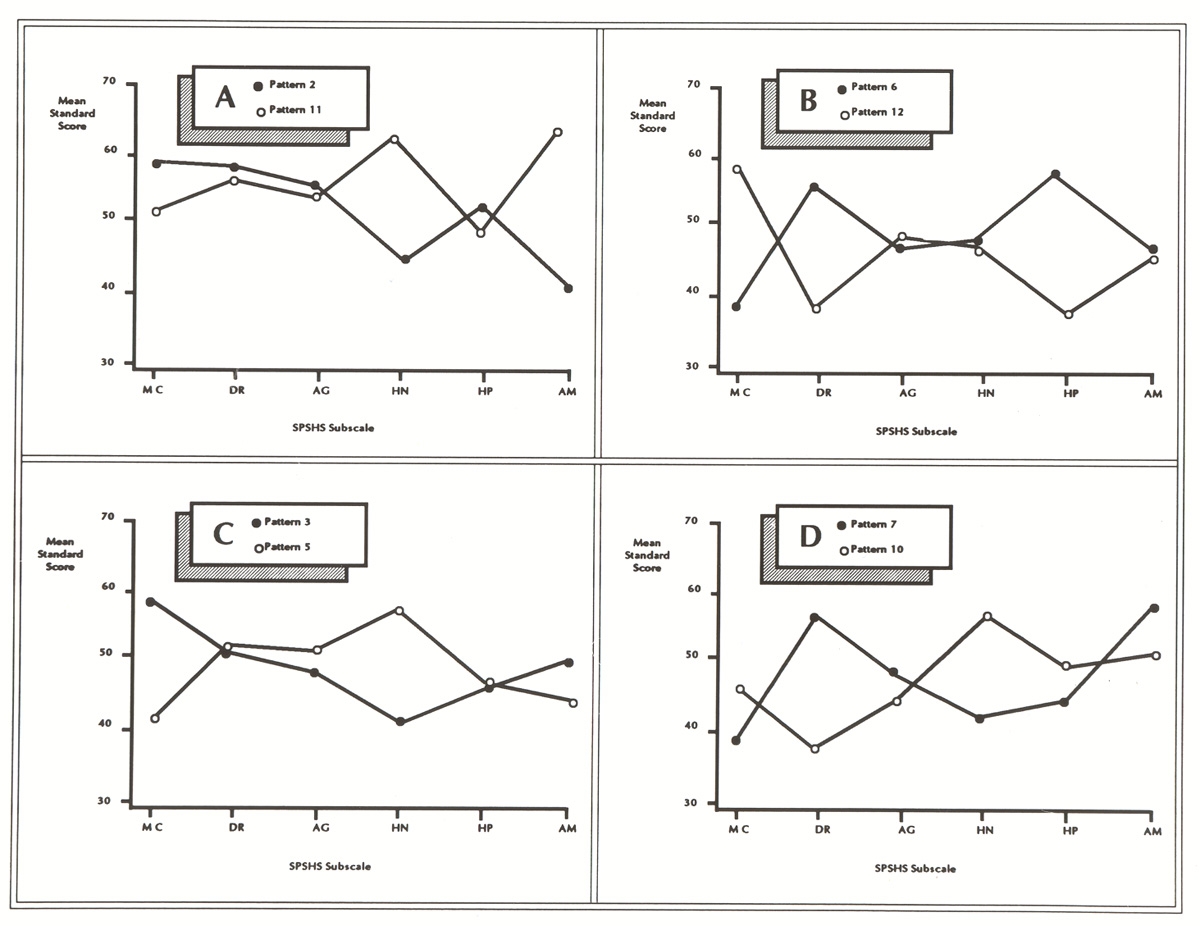
Some individual patterns provided clear contrasts with other patterns, and these pairs are presented together in Figure 2 in order to illuminate the findings of the cluster analysis. In Panel A, Patterns 2 and 11 were found to differ most markedly on scales HN and AM. In Panel B, Patterns 6 and 12 differed on three subscales: HP, DR, and MC. In Panel C, the major differences between Patterns 3 and 5 were on HN and MC. Finally, in Panel D, Patterns 7 and 10 differed on HN and DR.
Figure 2. Eight contrasting profiles of hypnotic abilities obtained from the cluster analysis.
The remaining profiles, which did not provide such clear contrasts, are presented in Figure 3. Pattern 1 had a very high score on only the AG subscale, while Pattern 4 showed a high score on MC and a low score on AM; the high subscale of Pattern 8 was AM.
Figure 3. Four noncontrasting profiles of hypnotic abilities obtained from the cluster analysis.
Interestingly, Pattern 9 revealed a lack of significant deviations from the mean -- i.e., it was flat. Examination of the scatter values for the profiles in the cluster represented by this pattern indicated that they were all relatively low (M = 11.33, SD = 1.65, compared to the mean of 15.09 for the entire sample of 155 subjects). The 13 members of this cluster should probably be grouped with the 28 flat profiles identified at the outset and removed from the sample before the cluster analysis was performed. Presumably most or all of these 28 profiles would also have been included in Pattern 9, had they not been excluded on an a priori basis. If so, flat profiles would account for approximately 26% of all 155 cases.
Because the cluster analysis was performed on the deviation score profiles, information about profile level did not enter into the clustering procedure itself. Therefore any empirical relations obtained between the profile patterns and general hypnotizability would be independent of the method of deriving the patterns. Two measures of general hypnotizability level were available for each subject in the present study: (a) total SHSS:C score (SHSS:C is preferable to SHSS:A as a criterion measure of hypnotizability; E. Hilgard, 1965); and (b) mean SPSHS subscale score, averaged across forms I and II (i.e., profile level). Separate unweighted- means ANOVAs revealed no significant differences among the 12 patterns in terms of either profile level or SHSS:C score. It appears, then, that all the clusters represented by the patterns contain profiles of subjects with a wide range of hypnotizability levels. No individual patterns are associated with particularly high or low general hypnotizability.
Although the present study has focussed on patterns of differential hypnotic abilities, flat profiles also represent a definite pattern of hypnotic responsiveness -- albeit one characterized by relatively even performance on all six ability areas. Because the pattern consists essentially of a horizontal line, information about profile level, rather than scatter or shape, is especially important to the description of these subjects' responsiveness to suggestions. Following a procedure outlined by E. Hilgard (1965; E. Hilgard, Lauer, & Morgan, 1963), the 28 flat profiles excluded from the cluster analysis at the outset and the 13 additional flat profiles obtained from Pattern 12 were further classified on the basis of their mean subscale scores: high (M > 54.9), medium (45.0 < M < 54.9), and low (M < 45.0). There were 13 generally high profiles (M = 63.84), and 22 generally low ones (M = 40.57), but only 6 flat profiles in the medium category (M = 49.47). For the 114 profiles showing at least one deviating subscale, these frequencies were, respectively, 26, 62, and 26. The two distributions were significantly different, X2(2) = 21.09, p < 0.001. Thus, there appears to be a tendency for subjects with flat profiles to be either high or low in general hypnotizability. The 13 subjects with high, flat profiles (8.4% of this total selected sample, and approximately 5% of the population at large), may properly be called "hypnotic virtuosos" because they respond at high levels to all sorts of hypnotic suggestions.
A total of 11 of the 127 profiles submitted to the cluster analysis formed extremely small clusters, ranging in size from 1 to 4 members. Although these residual profiles had a variety of "average" shapes, their scatter values tended to be the highest (M = 22.23, SD = 4.17, compared to the overall mean of 15.09) in the entire sample. The high degree of variability among the subscale scores comprising these profiles may account for their isolation in the clustering solution.
This study identified 12 basic patterns of performance on SPSHS. Of course, the best way to document the reliability of the clusters obtained here would be to repeat the analysis on another sample, or to divide the sample in half and analyze both subsamples separately. Unfortunately, the present data set is unique: no other large sample of SPSHS profiles is known to exist; and the entire sample is small enough that dividing it in half risks injecting further unreliability into the data analysis. Nevertheless, this situation has not prevented investigators in other domains (e.g., Block, 1971) from considering the heuristic implications of factor and cluster analyses whose results cannot be confirmed externally or internally.
The results of this study extend earlier factor-analytic research that suggested the presence of multiple component abilities underlying hypnotic responsiveness. In general, factor analyses lead to three types of solutions, paralleling the factor-analytic solutions to the structure of intelligence: a single, unitary factor; multiple uncorrelated factors, with no unitary factor; and multiple correlated factors, with a unitary factor running through them. In general, the available research supports the last of these models (E. Hilgard, 1965; but see Balthazard & Woody, 1985). The various factors in hypnotic susceptibility seem to represent different underlying facets that tend to co-occur and which, when simultaneously manifest, yield the kinds of hypnotic phenomena historically considered to comprise the domain of hypnosis (E. Hilgard, 1973).
The present data invites speculation about the relationships among these component abilities. For example, no pattern was obtained that combined low scores on HP with high scores on DR, or the reverse. These two sorts of items appear to be at least somewhat related, suggesting perhaps that a talent for producing vivid mental imagery underlies both types of items. On the other hand, HN and AM, involving inhibitions of perception and memory, respectively, are fairly independent of each other. This may suggest that there are separate capacities for dissociation that are somewhat specific to these functions. Similarly, subscale AG, involving disruptions in linguistic functioning, does not covary with is not strongly associated subscale AM, involving disruptions in memory, suggesting that different cognitive skills underlie the hypnotic effects on semantic and episodic memory.
This is not intended to represent an exhaustive list of component hypnotic abilities. For example, a more fine-grained analysis may be performed on each of these subscales. Within the AG subscale, for example, it may be that the agnosia and arithmetic items, which seem to involve a disruption in access to semantic memory, are different from the distortions of meaning which attend the personality alteration item. Similarly, in the AM subscale, the disruption of access to episodic memories may be distinguished from the performance of simultaneous tasks required by automatic talking or writing. Finally, the MC subscale may be further decomposed into separate scales for the facilitation and inhibition of motor responses (Hilgard, 1965), as indicated by factor analyses of SHSS:A/B and HGSHS:A, in a manner analogous to the distinction between positive and negative hallucinations or between amnesia and hypermnesia or age regression.
Aldenderfer, M.S., & Blashfield, R.K. (1984). Cluster analysis. Newbury Park, Ca.: Sage.
Anderberg, M.R. (1973). Cluster analysis for applications. New York: Academic.
Baker, F.B., & Hubert, L.J. (1975). Measuring the power of hierarchical cluster analysis. Journal of the American Statistical Association, 70, 31-38.
Balthazard, C.G., & Woody, E.Z. (1985). The "stuff" of hypnotic performance: A review of psychometric approaches. Psychological Bulletin, 98, 283-296.
Balthazard, C.G., & Woody, E.Z. (1986). Bimodality, dimensionality, and the notion of hypnotic types. International Journal of Clinical and Experimental Hypnosis, in press.
Blashfield, R.K. (1976). Mixed model tests of cluster analysis: Accuracy of four agglomerative hierarchical methods. Psychological Bulletin, 83, 377-388.
Blashfield, R.K. (1980). The growth of cluster analysis: Tryon, Ward, and Johnson. Multivariate Behavioral Research, 15, 439-458.
Block, J. (1971). Lives through time. Berkeley: Bancroft.
Block, J., & Ozer, D.J. (1982). Two types of psychologists: Remarks on the Mendelsohn, Weiss, and Feimer contribution. Journal of Personality and Social Psychology, 42, 1171-1181.
Coe, W.C., & Sarbin, T.R. (1971). An alternative interpretation to the multiple composition of hypnotic scales: A single role-relevant skill. Journal of Personality and Social Psychology, 18, 1-8.
Cronbach, L.J., & Gleser, G.C. (1953). Assessing similarity between profiles. Psychological Bulletin, 50, 456-473.
Everitt, B. (1974). Cluster analysis. London: Heinemann Educational Books.
Everitt, B. (1979). Unresolved problems in cluster analysis. Biometrics, 35, 169-181.
Hilgard, E.R. (1965). Hypnotic susceptibility. New York: Harcourt, Brace, & World.
Hilgard, E.R. (1973). The domain of hypnosis, with some comments on alternative paradigms. American Psychologist, 28, 972-982.
Hilgard, E.R. (1977). Divided consciousness: Multiple controls in human thought and action. New York: Wiley-Interscience.
Hilgard, E.R., Lauer, L.W., & Morgan, A.H. (1963). Manual for the Stanford Profile Scales of Hypnotic Susceptibility, Forms I and II. Palo Alto, Ca.: Consulting Psychologists Press.
Hubert, L.J. (1974). Approximate evaluation techniques for the single-link and complete-link hierarchical clustering procedures. Journal of the American Statistical Association, 69, 698-704.
Johnson, S.C. (1967). Hierarchical clustering schemes. Psychometrica, 32, 241-254.
Kihlstrom, J.F. (1985b). Posthypnotic amnesia and the dissociation memory. In G.H. Bower (Ed.), The psychology of learning and motivation. Vol. 19 (pp. 131-178). New York: Academic Press.
Kuiper, F.K., & Fisher, L. (1975). A Monte Carlo comparison of six clustering procedures. Biometrics, 31, 777-783.
Lauer, L. (1965). Factorial components of hypnotic susceptibility. Unpublished doctoral dissertation, Stanford University.
Marks, P.A., Seemon, W., & Haller, D.L. (1974). The actuarial use of the MMPI with adolescents and adults. Baltimore: Williams & Wilkins.
Mendelsohn, G.A., Weiss, D.S., & Feimer, N.R. (1982). Conceptual and empirical analysis of the typological implications of socialization and femininity. Journal of Personality and Social Psychology, 42, 1157-1170.
Olivier, D.C. (1973). AGCLUS: Aggregative hierarchical clustering program. Unpublished manuscript, Harvard University.
Osgood, C.E., & Suci, G.J. (1952). A measure of relation determined by both mean difference and profile information. Psychological Bulletin, 49, 251-262.
Shor, R.E., & Orne, E.C. (1962). Harvard Group Scale of Hypnotic Susceptibility, Form A. Palo Alto, Ca.: Consulting Psychologists Press.
Shor, R.E., & Orne, E.C. (1963). Norms on the Harvard Group Scale of Hypnotic Susceptibility, Form A. International Journal of Clinical and Experimental Hypnosis, 11, 39-48.
Skinner, H.A. (1978). Differentiating the contribution of elevation, scatter, and shape in profile similarity. Educational and Psychological Measurement, 38, 297-308.
Tellegen, A. (1978-1979). On measures and conceptions of hypnosis. American Journal of Clinical Hypnosis, 21, 219-236.
Tellegen, A., & Atkinson, G. (1976). Complexity and measurement of hypnotic susceptibility: A comment on Coe and Sarbin's alternative interpretation. Journal of Personality and Social Psychology, 33, 142-148.
Weitzenhoffer, A.M., & Hilgard, E.R. (1959). Stanford Hypnotic Susceptibility Scale, Forms A and B. Palo Alto, Ca.: Consulting Psychologists Press.
Weitzenhoffer, A.M., & Hilgard, E.R. (1962). Stanford Hypnotic Susceptibility Scale, Form C. Palo Alto, Ca.: Consulting Psychologists Press.
Weitzenhoffer, A.M., & Hilgard, E.R. (1963). Stanford Profile Scales of Hypnotic Susceptibility Scale: Forms I and II. Palo Alto, Ca.: Consulting Psychologists Press.
Weitzenhoffer, A.M., & Hilgard, E.R. (1967). Revised Stanford Profile Scales of Hypnotic Susceptibility Scale: Forms I and II. Palo Alto, Ca.: Consulting Psychologists Press.
This article is based on a paper, "Patterns of Hypnotic
Abilities", presented by Heather A. Brenneman at the annual
meeting of the Society for Clinical and Experimental Hypnosis,
Chicago, October 1980. This fuller report was originally
prepared 04/09/86
This research was supported in part by Grant MH-35856 from the National Institute of Mental Health, United States Public Health Service. The data employed in this study was originally collected by Lillian Lauer (Lauer, 1965). We thank Jean Chapman, Judith Harackiewicz, Irene Tobis, Carol Krumhansl, Robert Nadon, Patricia Register, Douglas Tataryn, Betsy Tobias, and James Wood for their comments during the conduct of the study and preparation of this paper.
1The item composition of subscales AM and MC differs from that of the standardized version of SPSHS in the inclusion of analogous items from SHSS:C as well as SHSS:A, in order to increase the reliability of these subscales. Return to text.
This page last modified 04/08/2010.