
New York City provides technological amenities such as computers and WiFi hotspots for public use. This project will examine how these amenties are distributed across the city. We will look at how libraries–the primary source of public computers–and free WiFi hotspots are distributed, as well as whether they are accessible for those who need them most. The locations of public WiFi hotspots and libraries were found using the NYC Open Data portal. Data regarding median income, population density, internet subscriptions in households, and access to computers in households for each census tract were drawn from 2013-2017 ACS estimates and the 2010 U.S. Census.
New York City’s three public library systems–the New York Public Library, Brooklyn Public Library and Queens Public Library–all offer branches with free computers. The NYPL, for example, allows users to log one 45 minute session on a computer at their neighborhood branch per day. Therefore, these libraries are a key resource for households without personal computers; in the 2016 fiscal year (July 2015-June 2016), the Brooklyn Public Library system’s 60 libraries logged a total of 12044 computer sessions.

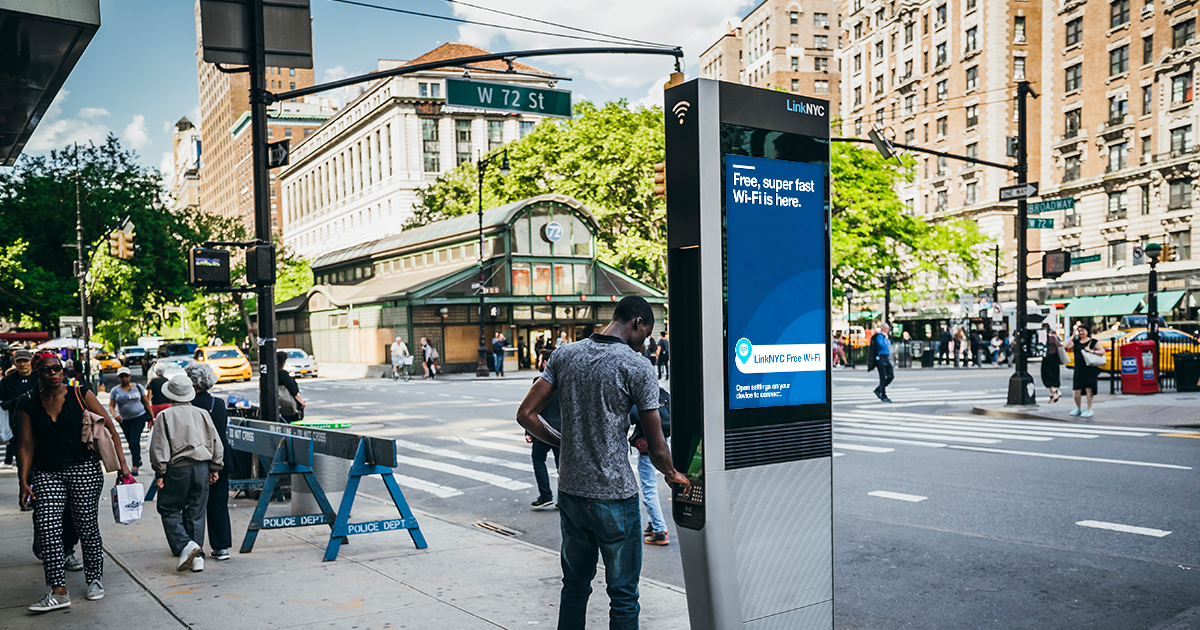
Through the LinkNYC program, the city also currently provides 1,900+ high-speed LinkNYC hotspots for public use. Most of the hotspot towers are directly replacing outdated payphones throughout the city. The routers don’t have usage data or time limits–making them very accessible. Since February 2016, over 1.5 billion sessions have been logged through the LinkNYC system. Approximately 1,400 other public hotspots of varying quality are provided by a variety of other organizations–such as the aforementioned public library systems and the New York City Transit Authority.
As a note, all of the following chloropleth maps will not include census tracts in New York City with null entries (ie. populations of 0). This is to ensure that null values do not get counted in the bottom quantile of each map’s categories.
Distribution of Hotspots and Libraries vs. Median Income
We began by looking at the distribution of public technological resources with the median incomes of census tracts. Historically, wealthier people have been able to advocate for more amenities through two means–paying more taxes, and having more accessible means of influencing government action through connections or political donations. Therefore, our initial hypotheses was that tracts with lower median incomes would have less libraries and WiFi hotspots.
Source: NYC Open Data “NYC Wi-Fi Hotspot Locations” and “Library” (2019) and ACS (2013-2017) Table S1903
The map above shows that libraries are fairly evenly distributed across New York City, with a slightly higher concentration around lower Manhattan and a lower concentration on Staten Island. This pattern does not align significantly with trends in median incomes; both Manhattan and Staten Island are very high-income regions.
The network of public hotspots is much less well-distributed, though there is a similar concentration around Manhattan. However, the Southern and Eastern parts of the city both have substantially fewer. The underserved areas include both high-income and low-income tracts. Even within Manhattan, hotspots tend to be further inland, rather than towards the island’s coasts.
The distribution of both libraries and WiFi hotspots suggests, therefore, that income is not a major determining factor for the placement of either amenity.
Are Libraries Accessible for Households Without Computers?
The fact that libraries and WiFi hotspots are not distributed based on income was an interesting finding. Therefore, we next analyzed whether libraries and WiFi hotspots were accessible to those who most needed technological amenities. First, we looked at whether libraries were located near households without computers.
Source: NYC Open Data “Library” (2019) and ACS (2013-2017) Table B2810
Regardless of a tract’s overall access to computers at home, the map shows that there is a library nearby. One notable takeaway from the map is in Staten Island. As noted above, the island has a low concentration of libraries compared to the rest of the city. However, the few libraries in the area seem to be placed near areas with less access to computers at home–indicating good coverage.
/cdn.vox-cdn.com/uploads/chorus_image/image/54582755/111028_15_57_58_DSC_0199.0.jpg)
Are Current and Future WiFi Hotspots Accessible for Households Without Internet Subscriptions?
The NYC Open Data portal not only had data on current hotspots, but also on future ones that had been approved and not yet installed. We overlayed the locations of current and approved future hotspots on a cloropleth map showing the percentage of households with broadband subscriptions in each census tract. This is because we believed groups without internet at home would likely find such hotspots much more useful–and therefore we would ideally want to see a good distribution of hotspots in those neighborhoods.
Source: NYC Open Data “NYC Wi-Fi Hotspot Locations” and “Approved Link NYC Kiosk Locations” (2019), ACS (2013-2017) Table B28011
WiFi hotspots are generally well distributed to meet the needs of areas with less internet subscriptions. Aside from Downtown Manhattan, areas that have greater access to internet have fewer hotpots. For Staten Island and Queens, the areas with lower access relative to the rest of the borough generally also have more hotspots. Moreover, hotspots are heavily placed in low access areas in Harlem as well. While these findings bear well for equity concerns for the most part, hotspots in Southern Brooklyn and parts of the Bronx are morely sparcely placed–considering the lack of internet subscriptions in both areas.
Interestingly though, we found that some of the neighborhoods in Southern Brooklyn with both the lowest percentage of internet subscriptions and the lowest concentration of hotspots are neighborhoods with historically large populations of Orthodox Jews–such as Borough Park and Parkville. Given that internet usage is considered somewhat taboo among Orthodox Jewish communities in New York, that may help explain the low number of internet-related amenities. However, it does not explain the similarly low numbers of hotspots in other neighborhoods in Brooklyn and the Bronx.

In regard to expansion, we can see that new WiFi hotspot network extensions are primarily occurring in two areas. The first is Manhattan–or the downtown core. This is unsurprising, given that it’s a significantly denser region. The other area that will see WiFi expansion is in Queens, specifically along Northern Boulevard and Main Street. These proposed hotspot locations will bridge the gap seen in the northern part of Queens, where they were previously more unevenly dispersed. However, they will not address the scarcity in Brooklyn and the Bronx’s neighborhoods with low internet subscription rates.
Distribution of Libraries and Hotspots vs Population Density
Given that the libraries and WiFi hotspots are not clearly distributed with respect to median income, access to computers, and access to home broadband internet, we decided to also take a look at population density. We thought density would correlate with the placements for both amenities because it is one possible indicator of the number of potential users in a given area. To note, population density data for each census tract was not available for American Community Surveys. Therefore, the following analysis was done with the 2010 U.S. Census’s data. Given more recent population changes, the map below may not accurately reflect the density of some tracts–but it should be reasonably accurate.
Source: NYC Open Data “NYC Wi-Fi Hotspot Locations” and “Library” (2019) and U.S. Census (2010) Table GCT-PH1
The map above shows a positive correlation between the locations of WiFi hotspots and areas with high population densities. This suggests that population density has been a large contributing factor in New York City’s placement of hotspots. However, many of the underserved parts of Brooklyn and the Bronx highlighted above also have high densities–suggesting that there is still room for improvement.

There does not appear to be a strong correlation between the placement of libraries and the distribution of census tracts with high population densities. Staten Island, as mentioned above, is the neighborhood with the lowest density of libraries. It also has a low population density–making the low number of libraries logical. Similarly, Manhattan is a very high-density neighborhood, and has a greater number of libraries per square mile.
Conclusion
In conclusion, our findings reveal that our initial hypothesis did not hold; access to public wifi hotspots and libraries is not correlated with median income in tracts. Rather, libraries were generally evenly distributed, and the locations of WiFi hotspots roughly correlated with the population densities of different census tracts in New York City. Overall, the maps we generated exhibit that New York City has done a good job of distributing public hotspots and libraries in communities with the greatest need. However, we did notice that it has underserved the Bronx and the southern half of Brooklyn with regard to WiFi hotspots. Although the LinkNYC network is still being extended, the proposed future hotspots also neglect this area. Thus, we recommend that the city invest more into increasing access to internet and computer-related amenities in the Bronx and the southern areas of Brooklyn.
Access to more data could certainly extend this analysis. Data regarding the number of computers at each library location, and usage data for both public computers and WiFi hotspots, would give a more holistic picture of accessibility. Furthermore, the dates that hotspots were installed would allow us to track accessibility over time. Unfortunately though, none of that data is currently available to the public.