Introduction
The San Francisco Bay Area has been in a housing crisis for years, suffering from a shortage of affordable housing stock due to a long history of low housing production, a booming technology sector along with a number of other factors. This crisis has resulted in increased poverty rates, a growing homeless population, displaced residents, and constrained economic growth. While there are many efforts underway to address the shortage of housing stock, especially that which could be considered affordable to lower income residents (i.e. doesn’t cost more than 30% of their household income), every option needs to be on the table in order to increase the housing stock as soon as possible while maximizing the proportion that is affordable to those earning at and below the median income level. One possibility is to incentivize developers to build on vacant land in the hope of reducing crime and blight, and increasing economic activity, public revenue, and housing stock.
Historical trend for annual permitted housing units in the Bay Area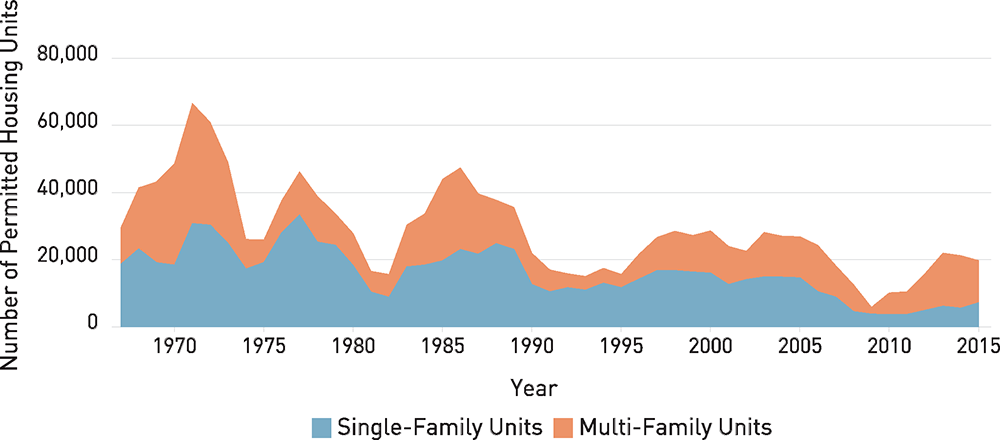
Median home sale prices by metro area from 1997 to 2016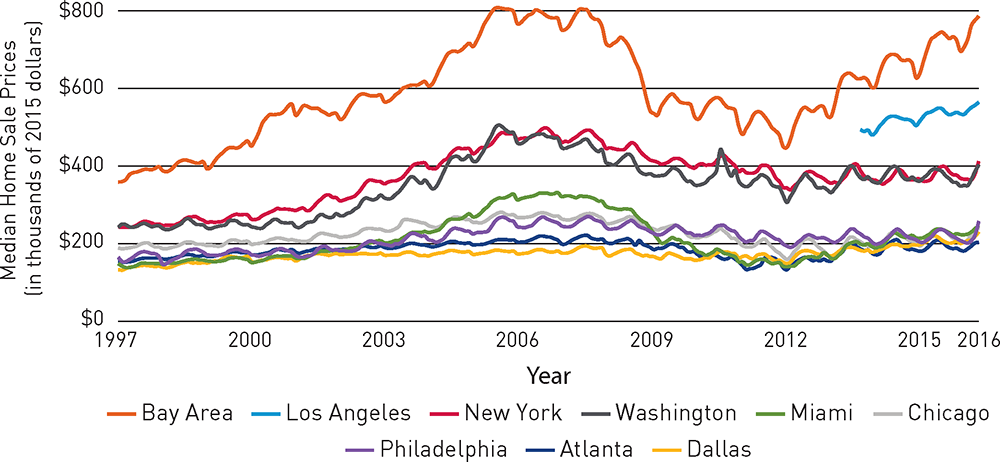
Share of income spent on housing by Bay Area households in 2015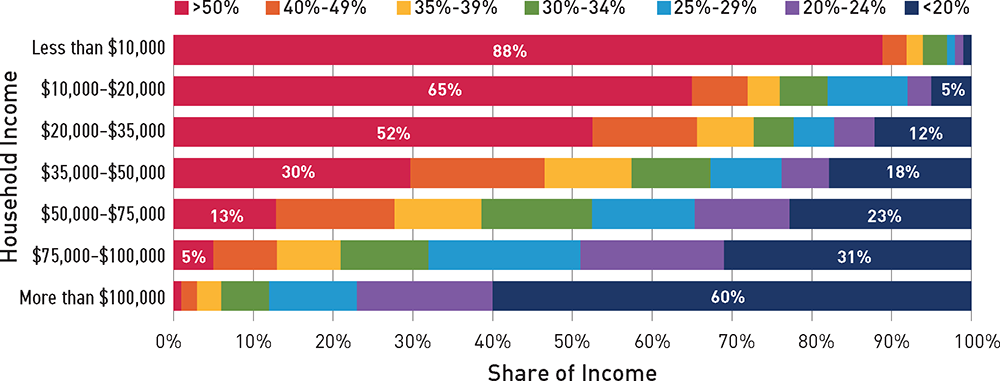
Source: Plan Bay Area 2040 Final Plan
Background
Some City of Oakland council members believe that the City suffers from a relatively high number of blighted and underutilized parcels while the price per square foot of housing continues to rise, and that speculative real estate interests are at least partially to blame. In buying and holding land until it’s zoning code is converted to residential and therefore worth substantially more, these speculators are delaying development at a time of great need. To spur development, decrease costs associated with vacant parcels, and increase revenue, the City is exploring a vacant land tax ballot initiative in 2018. In light of this, I decided to explore what the distribution, attributes and patterns of Oakland’s vacant parcels, and model the revenue that would be generated by a hypothetical tax.
Vacant Land Taxes
Experimental taxes are being proposed in cities across the coutnry that struggle with housing availability and/or vacant blighted property. Land value taxes aim to put higher taxes on land and lower taxes on the improvements built on top of the land in order to incentivize density and development. In November 2016, Vancouver, BC passed an empty homes tax that levies a one percent tax on property’s assessed value on homes that are not occupied for at least 6 months out of the year, in an effort to bring more rental units onto the market. A vacant land tax, on the other hand, would target a specific tax on vacant properties in order to raise revenue to alleviate the negative effects that they have on the surrounding community, and to encourage development and discourage speculative holding during a period when the region is starving for housing stock. The argument against this type of anti-speculation tax is that the speculators are holding land for a market-optimized use, and by rushing the development timeline, you will be getting suboptimal use of the property and potentially less dense buildings if development isn’t staggered and unit vacancy grows. However, this is not a concern for a housing market as overheated as the Oakland’s.
I’m modeling this analysis off of the vacant land tax established by Washington DC in 2011. Under this policy, vacant land owners were required to register their property or face a fine, and their vacant property would be taxed at a rate of $5 per $100 of appraised value. They also added an additional tax on blighted property set at $10 per $100 of appraised value, however this would require a city to establish a formal definition of blight and have a fully staffed inspection office that could enforce the rule. An additional policy could provide rebates to vacant land owners who develop their property within a reasonable period of time to further incentivize faster turnaround.
Datasets
In order to complete this analysis, I utilized income and demographic data from the US Census, tax and parcel data from the Alameda County Assessor’s Office, point data of relevant public resources from the City of Oakland, and a map of BART station locations from CalTrans. All of the data was downloaded from the sites linked below with the exception of Census data, which was accessed through an API.
Census 5 Year American Community Survey (via API)
- Total households by census tract
- Median household income by census tract
Alameda County Assessor’s Office
City of Oakland
- Map of Oakland Public Schools
- Map of Oakland Parks and Recreation Facilities
- Map of Oakland City Limits
- 2015 Crime Data
The parcel tax data from Alameda County contained a field called “Use Code,” which is an updated status that appraisers note for a property after inspection. Given that re-appraisals are triggered by property owners filing the proper paperwork that notifies the assessor of the sale of a property or the start or end of construction, this code may not always be a completely accurate reflection of the status of the property. However, given that the City of Oakland doesn’t formerly track vacant properties or require owners to register vacant properties, this is the only official record that could be found. Further research could cross-reference this list with data from city building inspectors and separate datasets that the utility companies and postal service keeps on property vacancy. However, in this analysis I pulled the use codes that contained the keyword “vacant” and used the codes below to create a subset of vacant parcels.
Vacant Use Codes
800: Vacant residential tract lot
1000: Vacant residential land, zoned 4 units or less
1040: Vacant residential land, R&T 402.1
3000: Vacant commercial land (may include misc. imps)
4000: Vacant industrial land (may include misc. imps)
5000: Vacant rural-res homesites, may incl misc. imps
5700: Vacant rural land, not usable even for agriculture
5900: Vacant rural land, non-renewal Williamson Act
6000: Vacant land necessary part of institutional prop.
6001: Government owned property – vacant land
7000: Vacant apartment land, capable of 5 or more units
7040: Vacant apartment land, R&T 402.1
7090: Vacant apartment common area or use
Analysis
All of the cleaning and analysis of this data was done in python, with interactive map visualizations presented with Carto. The below table summarizes the sum, median, and mean for key values in the list of vacant parcels.
Vacant Parcel Summary Statistics
| Total Net Value | $1,070,619,462.00 |
| Median Net Value | $46,766.50 |
| Mean Net Value | $258,478.87 |
| Total Land Value | $953,303,097.00 |
| Median Land Value | $47,746.00 |
| Mean Land Value | $230,155.26 |
| Total Improvements Value | $127,205,115.00 |
| Median Improvements Value | $0.00 |
| Mean Improvements Value | $30,711.00 |
| Total Area | 15,613,832,452,578 sqft |
| Median Area | 1,430,580,226 sqft |
| Mean Area | 15,666 sqft |
| Total Value per SQFT | $94,522.24 |
| Median Value per SQFT | $8.35 |
| Mean Value per SQFT | $22.82 |
The following interactive maps display the geographic distribution of vacant parcels, with the addition of data summarized to the census tract level added as a contextual layer for reference.
Vacant Parcels
Parcels by Type and Median Income
Parcels by Value on Median Income
(darker shade = higher value)
Parcel Value per SQFT
(darker shade = higher value)


Conclusions
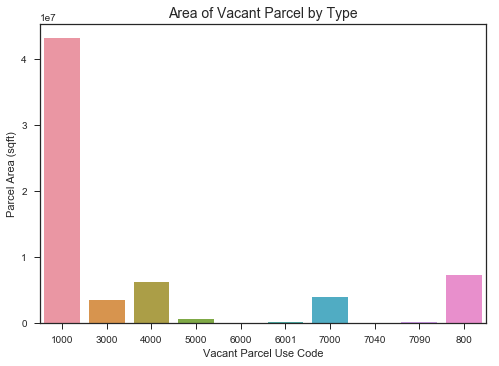
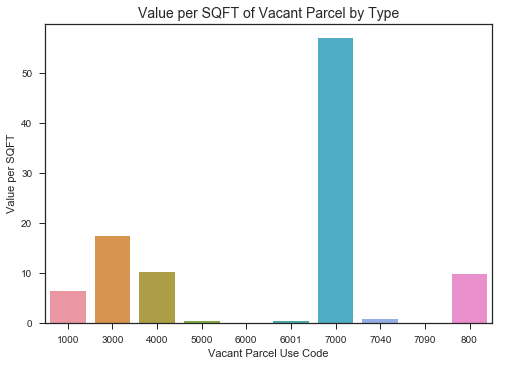
If a vacant land tax modeled after Washington DC, a $5 tax per $100 of assessed value, were to be levied on all of the vacant properties that I identified in this analysis, the total revenue generated by the tax would be $53,530,973.10 for all 4,142 vacant parcels. The median tax per parcel would be $2,338.33, and the mean tax per parcel would be $12,923.94. A surprising finding from this data was that residential lots zoned for fewer than four units had the most area, while unsurprisingly the highest value per square foot belonged to parcels zoned for high rise residential lots.
Limitations
The “use code” indicator of vacant properties is only one of many that could indicate vacancy, as these indicators differ by definition, breadth and accuracy. Having updated parcel tax data also relies on a property owner filing forms to trigger an assessment and appraisal. Finally, the political and legal feasibility of this tax may be limited by CA Proposition 13, so implementation might have to differ from the Washington DC case study.