New paper coming out in ZDM: International Journal of Mathematics Education!
Wilkerson, M. H. & Laina, V. (In Press). Middle school students’ reasoning about data and context through storytelling with repurposed local data. To appear in ZDM: Mathematics Education.
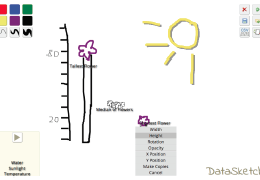
Publicly-available datasets, though useful for education, are often constructed for purposes that are quite different from students’ own. To use these to investigate and model phenomena, then, students must learn how to repurpose the data. This paper reports on an emerging line of research that builds on work in data modeling, exploratory data analysis, and storytelling to examine and support students’ data repurposing. We ask: What opportunities emerge for students to reason about the relationship between data, context, and uncertainty when they repurpose public data to explore questions about their local communities? And, How can these opportunities be supported in classroom instruction and activity design? In two exploratory studies, students were asked to pose questions about their communities, use publicly-available data to explore those questions, and create visual displays and written stories about their findings. Across both enactments, we found that such opportunities emerged especially when students worked to reconcile (1) their own knowledge and experiences of the context from which data were collected with details of the data provided; and (2) their different emerging stories about the data with one another. We review how these opportunities unfolded within each classroom enactment at the level of group and classroom, with attention to facilitator support.