Although not strictly used for mathematics, LaTeX it is an extremely useful tool for typesetting. It is a what you see is what you mean editor, in that formatting is done using LaTeX's own unique markup language. LaTeX allows one to do a number of typesetting tasks automatically, that can be major headaches using a traditional word processor. Finally, LaTeX allows for the beautiful display of mathematics. I will not cover usage here, but you can find a lot of information at LaTeX's homepage.
cd /usr/ports/print/teTeX
make install clean
This will take a while, but will provide us with a LaTeX distribution to work with. If you have a .tex file that you want to convert into .pdf, use the following command:
texi2pdf -c file.tex
The 'c' flag will clean all of the extra files that are created to process the .tex file.
If you want to add a new style to your distribution, there are a few steps you must follow. First, create a directory for it (corresponding to the style's name 'anonchap' for this example) and move the style into it (these commands are written from the directory containing the style):
mkdir /usr/local/share/texmf-dist/tex/latex/anonchap/
mv anonchap.sty /usr/local/share/texmf-dist/tex/latex/anonchap/
Now we just need to update the distribution:
texhash
Good luck with the wonderful system that is LaTeX!
In the world of unix-like operating systems, PyX is by far the most useful and powerful plotting software I have encountered. PyX is really just a graphics package for python, so when working with PyX one has access to all of the power (and headaches) of python. One excellent feature of PyX is that it provides one with the wonderful typesetting capabilities of LaTeX, which allows one to generate wonderful looking images.
cd /usr/ports/graphics/py-PyX
make install clean
python file.py
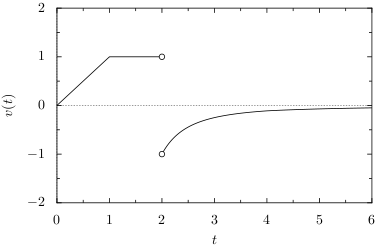
Although PyX provides quite a learning curve to using, I will provide a sample file `derivative_velocity_car.py' here to give some indication of what it is capable of.
from pyx import *
from pyx.graph import axis
def f(x):
if 0 <= x < 1: return x
elif 1 < x <= 2: return 1
def h(x):
if 2 < x < 4: return -1/(x-1)**2
elif 4 <= x: return -16/(9*x**2)
g = graph.graphxy(width=8,
x=axis.linear(min=0, max=6, title="$t$"),
y=axis.linear(min=-2, max=2, title="$v(t)$"))
g.plot(graph.data.function("y(x)=f(x)", context=locals(), points=500))
g.plot(graph.data.function("y(x)=h(x)", context=locals(), points=500),[graph.style.line([style.linestyle.solid])])
g.finish()
g.stroke(g.ygridpath(0), [style.linestyle.dashed,style.linewidth.Thin])
g.stroke(g.xgridpath(0), [style.linestyle.dashed,style.linewidth.Thin])
u1,v1 = g.pos(2,1)
u2,v2 = g.pos(2,-1)
g.stroke(path.circle(u1,v1,0.07),[deco.filled([color.rgb.white]) ])
g.stroke(path.circle(u2,v2,0.07),[deco.filled([color.rgb.white]) ])
g.writeEPSfile("derivatives_car_velocity")
python derivatives_car_velocity.py
and python will write a derivative_car_velocity.eps for us. Next we convert to .pdf usingepstopdf derivatives_car_velocity.eps
The resulting image is given below.Inkscape is a vector graphics editor, in contrast to a raster image editor, like GIMP. What this means is that drawings are made using mathematical objects (vectors) rather than pixels. This greatly reduces the size of images, as well as adding resizability without any loss in quality. For generating somewhat complicated images (other than plots), inkscape serves as a very nice alternative to PyX. Also, inkscape allows for the usage of LaTeX-text, which is a must.
cd /usr/ports/graphics/inkscape
make install clean
cd /usr/ports/graphics/pstoedit
make install clean
cd /usr/ports/devel/py-lxml
make install clean
cd /usr/local/share/inkscape/extensions
mv textext-0.4.2.tar.gz .
tar -xf textext-0.4.2.tar.gz
inkscape &
In order to use LaTeX text, choose 'Tex Text' from the Effects menu.