FINANCING the UNIVERSITY – Part 16
by Charles Schwartz, Professor Emeritus, University of
California, Berkeley
schwartz@physics.berkeley.edu
November 4, 2008
>> This series is available on the internet at
http://ocf.berkeley.edu/~schwrtz
THE NEW PUSH FOR TRANSPARENCY
Mark Yudof entered into the position of
President of the University of California with a proclamation that he
would advance the cause of Transparency and Public Accountability at
this institution. That is a very popular campaign promise nowadays:
“My administration will set a new
standard for transparency and accountability.”
-- Senator John McCain, in his speech accepting the Republican
Party nomination to be President of the United States, September 4,
2008.
At the July meeting of the UC Board of
Regents, President Yudof outlined his plans and said that the first
accountability report would be presented at the September
meeting. The draft report, issued September 21, 2008, is a
very large document: 211 pages in a pdf file of 1.4 Megabytes; the
Table of Contents shows it divided into 10 topical Sections, with a
total of 102 “Indicators”, that is, graphical presentations of data. A
link to that document is given at the end of this paper.
Much of this is familiar to me; but I am a UC
data junkie. Others may be simply overwhelmed by the vastness of the
package. (I think it is a standard courtroom strategy of litigators: if
the opposition wants “discovery”, drown them in paper.) Without
some effort to prioritize this can lead to pointless chaos: defenders
can select data and trends that make them look good while critics can
do the opposite.
In his initial public statements about this
initiative, President Yudof said:
“In the wake of the Enron scandal, the
Sarbanes-Oxley Act and the subprime mortgage lending meltdown,
Americans are demanding more accountability from their private as well
as their public institutions.” [UC press release 7-29-08]
That points to the issues of clear and honest financial accounting; and
that coincides with much of my own work. I believe that no subject is more
in need of transparency and accountability at UC than seeing where the
money comes from and where it goes. As will be noted below, however,
this draft report is poorest in that area.
The central question is whether this
enterprise is guided by the principles of truth and openness, which lie
at the heart of the academic institution, or by a public relations
program designed to serve some other objectives. My comments on
the current draft report are contained in several sections, labeled
A-H, below.
A.
Need for Responsible Oversight
There are some pages of data in Yudof’s draft
report involving money, where it is said that the numbers are in
dollars, when actually they are in thousands of dollars; and there is
one where exactly the opposite error occurs. There is doubtless a staff
of people who worked on assembling this report and there is always the
possibility of simple errors; but there ought to be somebody in charge
of the enterprise, someone with the background knowledge, talent and
responsibility to proofread the final work and catch such embarrassing
errors.
Here is another example of gross mistakes at
the top, told in an email I wrote on August 24:
Dear President Mark Yudof;
I write to alert you to a situation that sharply contradicts the
University’s avowed commitment to “transparency and public
accountability.”
The “Report on 2007 Employee Payroll”, released by your office last
month, has a summary page that indicates that only a very small portion
of the total systemwide compensation came from student fees. That
caught my attention and so I looked closer, at Table 2, Total Pay by
Fund Groupings. There was the detailed data claiming that only
$101 Million of all UC compensation (1.1% of the total $8.9 Billion)
came from the Educational Fees and Registration Fees paid by our
students.
For further relevant data, I looked at the latest official UC budget
and there learned that, for 2007-08, income from student fees are
detailed at $1,270 Million from the Educational Fee and $167 Million
from the Registration Fee. That adds up to $1,437 Million, which
is 14 times the $101 Million
reported going to compensation.
There seems to be some kind of data mismanagement here; and that is
certainly not good for UC’s credibility. I expect you will want
to look into this situation and take appropriate corrective action.
Please keep me posted.
A few weeks later I received a reply from a member of Yudof’s staff,
saying,
[We] are going to devise a methodology
for future disclosures that more accurately reports the relationship
between student fees and employee compensation.
Thank you for bringing this to our attention.
I wonder if that mistake was due to simple
carelessness or to some really bad accounting habits.
B.
Constant Dollars
Several of the Indicators show amounts of
money as they have evolved over a number of years; and these are
labeled as “constant dollars.” Well, it might be reasonable to
apply some adjustments for inflation in such studies; but which
technique is being used?
The CPI (Consumer Price Index) is the most
commonly used deflator; and this would be relevant to the average
citizens looking at the costs they face. But there is also something
called HEPI (Higher Education Price Index), which is often used by
universities and colleges when they talk about their finances over
time. What HEPI measures is the growth in cost/spending by the
Higher Education industry; thus, to compare your statistics to that
yardstick says nothing more than that you are keeping up with the
average escalation in college prices.
C.
Data on Students
The majority of this draft report, six out of
the ten sections, present various data related to students at UC. There
are certainly areas here that need improvement but this is not
something that I have personally studied much and so I leave that to
other experts. I would merely offer the personal opinion that,
overall, it looks pretty good: UC is a great teaching institution. (Of
course, it is also true that UC is a great research institution, as
shown in Sections 7,8,9.)
However, in the section titled “Undergraduate
Student Success” I did notice Indicator 1.9, which gave data on Plans
of Graduating Seniors: at Berkeley 40% were planning on
graduate/professional school. Also, Indicator 1.8 gave Highest Degree
Aspirations for Graduating Seniors: at Berkeley 27% aspired to a
Doctorate. There is some other official data for the Berkeley
Campus that seems to contradict those numbers quite severely
(http://career.berkeley.edu/CarDest/2007Grad.stm
): a survey of seniors some months after
graduation found that only 18.9% were enrolled in a
graduate/professional school and only 5.5% of them were enrolled in a
PhD program. One can certainly expect that the two surveys should
differ somewhat; but such a large discrepancy calls somebody’s
methodology into question. I would suggest that these items should be
removed from Yudof’s report or, alternatively, the two sets of
conflicting data should both be presented
D.
The Need to Disaggregate
Sometimes data is bundled into large
categories that hide or even misrepresent important details. Here
are three examples where we can call for specific disaggregation.
The sections of Yudof’s report concerning
students and faculty have data on diversity, ethnic and gender
distributions for the whole university or for individual campuses. This
bundling obscures the fact that there are strong variations in these
measures among different academic disciplines; and a bit of that detail
is noted for faculty following Indicator 7.5 in the draft report. For
more specific
information, there is a chart at http://www.ucop.edu/acadadv/datamgmt/welcome.html
that details Ladder Rank Faculty at UC by Field and Sex for October
2006: overall, women were 27.8% of the faculty but counting only the
fields of Physical Sciences, Mathematics and Engineering, women were
only 13.1% of the faculty. Somewhere, there should be analogous data
for students at each degree level, but I could not find it.
The Student-Faculty Ratio is presented in
Indicator 7.6, for all UC and for each campus over several recent
years. There is some discussion about how those numbers are calculated
but it is unclear. I have written about this topic in the past and
noted that it is nonsensical to combine undergraduate and graduate
students in the count for this calculation. For students in PhD
programs, the majority of UC’s graduate students, it can be shown that
the better ranked programs will show higher Student-Faculty Ratios.
This is just the opposite of what one usually thinks the S/F ratio is
supposed to mean. So I recommend that this data be disaggregated
as to student level. I would also suggest that one distinguish between
Professors and Lecturers in the Faculty counts appropriate to each
group of students: this is because those two faculty groups carry very
different teaching loads.
Indicator 10.3 is titled, “Per-Student Average
Expenditures For Education” over several years. For the most recent
year, 2007-08, the total figure shown is $17,070 and it also notes that
Student Fees amount to 29% of this total per-student expenditure for
education. I have written extensively about the grossly
misleading character of this data, as it has been regularly presented
in the UC Budget. What they call “Expenditure For Education” is really
a big bundle that covers all of undergraduate education plus graduate
education plus faculty research throughout the academic year. One must
disaggregate the expenditure for undergraduate education from that
whole bundle in order to obtain a truthful measure; and in my several
papers I have shown how to do this in a rational and objective manner,
using a variety of official data from the University. My result is that
undergraduate student fees at UC are now at a full 100% of what this
university spends, averaged per student, for undergraduate education.
That contradicts the 29% quoted in Yudof’s report. For more
details, see http://ocf.berkeley.edu/~schwrtz/Approp.pdf
E.
What’s Missing - Data on the UC Bureaucracy
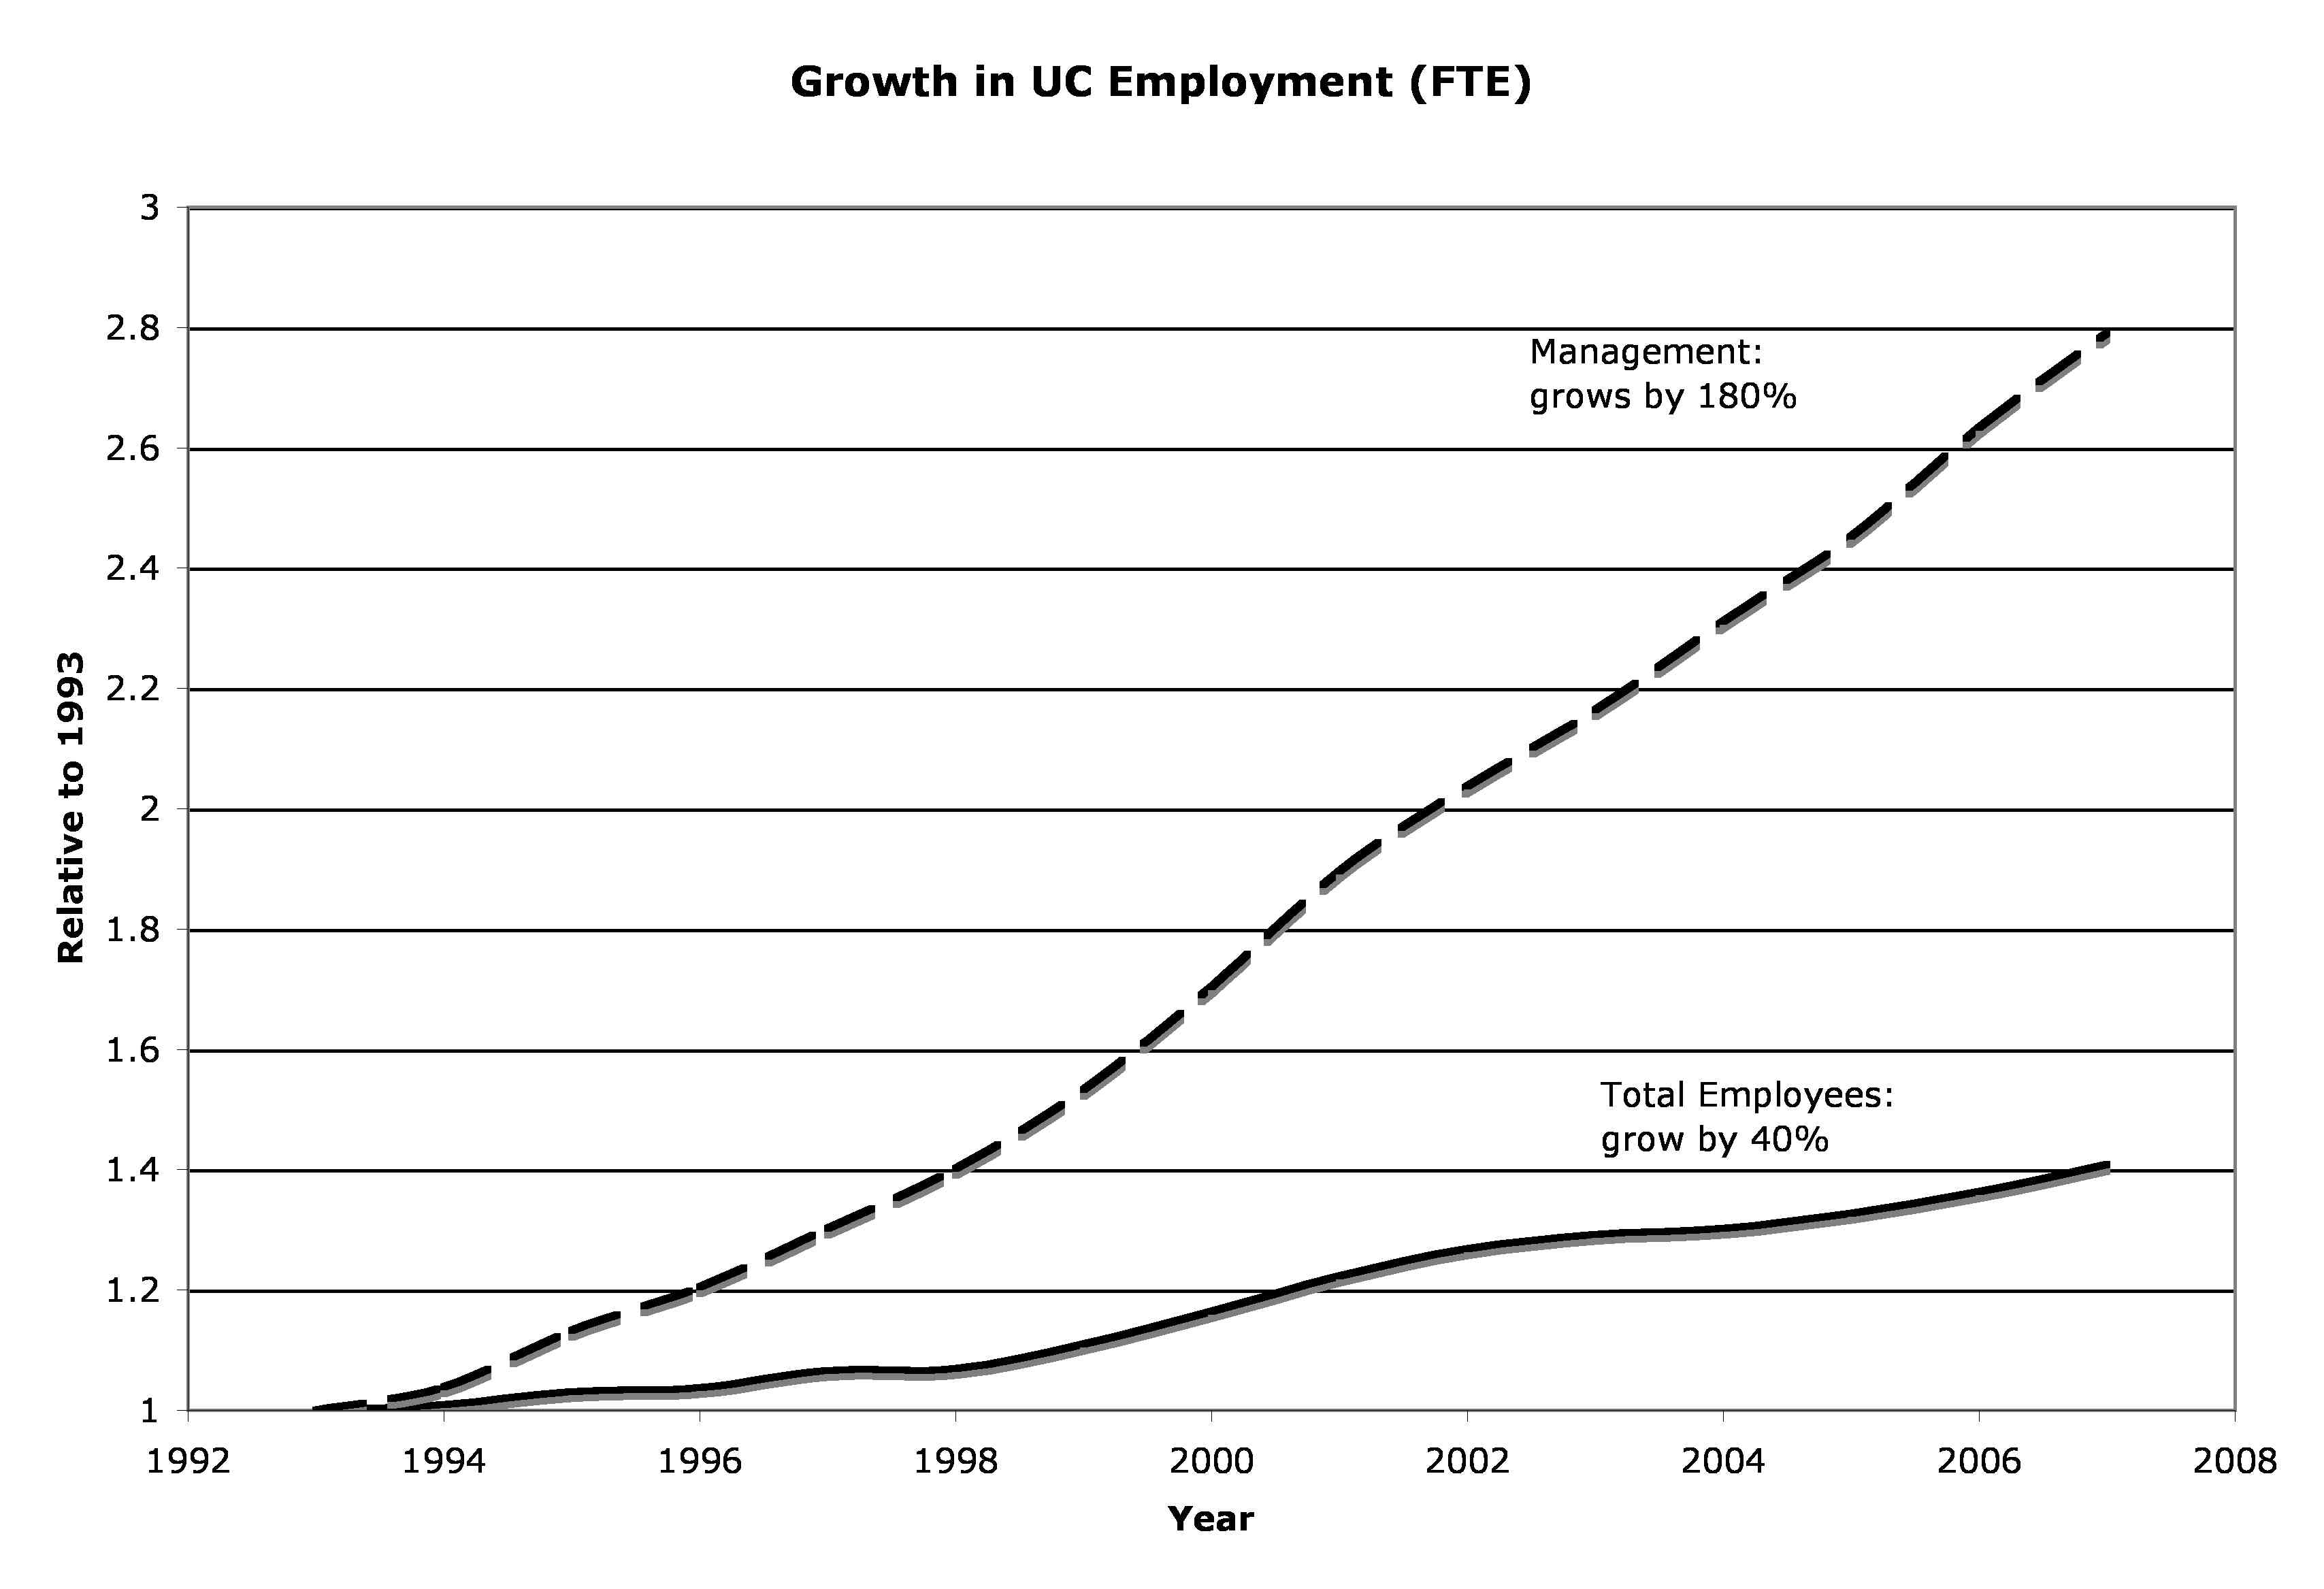
The graph that appears below shows data taken
from an official posting of employment statistics for all of UC.
(Tables of Academic and Staff FTE, which may be found at
http://www.ucop.edu/ucophome/uwnews/stat/
)
Over the period from 1993 to 2007 the total employment rose by 41%,
from 93,458 to 131,567 FTE; and the class of employees described as
Management (SMG & MSP) rose by 179%, from 2,804 to 7,825 FTE.
I have written about this apparent
bureaucratic bloat before (“Financing the University,” Parts 13, 14)
and have asked responsible UC administrators if there was any
justification for that outsized growth in management staffing. My
estimate is that this is wastage costing the university about $600
million per year.
In another recent document from UCOP (Higher
Education Compact Performance Measures 2006-07) I find the
contradictory claim (on page 21):
“Between 1986-87 and 2006-07,
systemwide administrative expenditures have
declined from 11.8% to 7.6% of total University expenditures.”
I have heard such claims in the past but have never seen an explanation
of how those numbers are arrived at. I am skeptical of their
reliability.
Yudof’s Accountability Framework should not
ignore this subject.
F.
What’s Missing – Disclosures re the Pension Fund
The University’s Pension Fund (UCRP), which is
under the direct supervision of The Regents, has recently been a topic
of keen interest to many employees; and it has also been a major area
for my own investigations and writings. Here is a list of informational
items which I have asked to be routinely published.
• Quarterly performance reports for each external investment manager
engaged by UC;
• Quarterly reports that compare UCRP investment performance to that of
relevant peer groups.
• Annual reports detailing expenses/fees paid out to external
investment managers and consultants; also any internal expenses/fees
paid out of the Fund.
• Annual report detailing commissions paid on securities transactions.
All of these data are routinely published by
the state’s largest public pension funds, CalPERS and CalSTRS. In
the spirit of Transparency, UC should do so too.
G.
What’s Missing - Data on Discretionary Funds
As I regularly browse through the University’s
accounting reports (“Campus Financial Schedules” is my favorite UC
publication) my eye is caught by a category of funds described as
coming from “Other Sources.” On Schedule 12-D for the fiscal year
2006-07, the total expenditure of Current Funds from “Other Sources”
amounted to $581,445,000. I wonder what that is all about.
Another category of money I have heard about
is called “Discretionary Funds.” One source of this is gifts and
endowments to the University where the donor has not specified the
purpose; that is left to the discretion of the Chancellors or some
other top administrators. I believe that a substantial portion of the
Indirect Cost Recovery (from Federal research contracts and grants)
also gets passed around among administrators as discretionary funding.
Maybe these two opaque classifications of
money are related. I am not suggesting that there is improper use
of such funds: I merely ask that they be put on the table for the new
Transparency project that President Yudof has undertaken.
H.
Other
Some additional topics that may be of
interest: mix of professors and lecturers over the years; fraction of
undergraduate classes taught by each category of faculty; data on
the distribution of undergraduate class sizes.
Finally: Indicators 10.11/12 show “Endowment
per Student”; that’s an oxymoron.
President Yudof has invited everyone to look over
his draft report and offer comments and suggestions for improvements.
The link is
http://www.universityofcalifornia.edu/accountability/
The Academic Senate will be conducting its own review of the report and
so faculty members may wish to send their comments by that route.