Financing the
University –
Part 22
Charles Schwartz, Professor Emeritus,
UC
Berkeley, February 27, 2013
Schwartz@physics.berkeley.edu http://ocf.berkeley.edu/~schwrtz
COST ACCOUNTING at
a RESEARCH
UNIVERSITY
My
previous study on this topic, with the title, “The Cost of
Undergraduate
Education at the University of California – Improved Calculation”, was
posted
in late 2007 at http://ocf.berkeley.edu/~schwrtz/recost.html.
It
concluded
that
the current level of mandatory fees for resident
undergraduate students is very close to 100% of the University’s actual
expenditure for undergraduate education, averaged per student. In
contrast, University officials said that student fees covered 30% of
the cost
of education.
New
results reported here, for the year 2011-12, show University
expenditures of:
$1.296
Billion for Undergraduate Education = $6,910 average cost per student;
and
$2.117
Billion for Faculty Research (unsponsored) and related Graduate
Programs.
The mandatory fee level for resident undergraduate students was $13,181, which is nearly twice what it cost the University to provide their education. In this paper, I shall review the method used before, then go through the steps with the latest input data. At the end is a critical discussion of the implications of these financial facts, including an indictment of the University leadership for their dishonesty.
I. Introduction
The University of
California (UC) is engaged in many activities, with an annual operating
budget
of around $23 Billion, funded by a variety of sources. Table 1, below,
displays
a standard breakdown of UC’s Operating Expenses by Function.
Table 1. UC Operating Expenses by Function for
FY 2012 ( in $Millions)
|
Uniform Classification Category |
Nominal Exp’s |
Actual Exp’s |
|
Instruction (I) |
5,146 |
4,571 |
|
Research (R) |
4,325 |
4,195 |
|
Public Service (PS) |
591 |
545 |
|
Academic Support (AS) - including Libraries |
1,910 |
1,812 |
|
Student Services (SS) |
780 |
710 |
|
Institutional Support (IS) |
1,118 |
775 |
|
Operation and Maintenance of Plant (OMP) |
587 |
540 |
|
Student Financial Aid (SFA) |
601 |
601 |
|
Medical Centers (MC) |
6,691 |
6,366 |
|
Auxiliary Enterprises (AE) |
1,089 |
1,019 |
|
Depreciation and Amortization (DA) |
1,477 |
|
|
Department of Energy Laboratories (DOE) |
1,008 |
1,008 |
|
Total
|
25,323 |
22, 142 |
Notes to Table 1. The Nominal Expenditures
can be
found in the UC Annual Financial Report 2011-12, page 8, under
“Operating
Expenses by Function.” The Actual Expenditures differ by not adding the
“Retiree Health Benefit and Pension Accrual,” which are not real
expenditures
but a required bookkeeping of future obligations (totaling $2,449
Million), and
by not subtracting the “Expense Capitalized” items (totaling $748
Million),
which cover just about half of the Depreciation and Amortization amount
seen in
the first column. One may find both the Nominal and the Actual
Expenditures
data (without the full DA) in the UC Campus Financial Schedules (CFS),
Schedule
12-H. All of those official accounting reports are available at http://www.ucop.edu/financial-accounting/financial-reports/index.html
The first question we
want to address is: How well (or poorly) does this classification
scheme tell
about the expenditures in terms of familiar missions of the University
and its
several clienteles. The question, “Who pays for what?” will come later;
and I
am especially interested at getting down to details about student fees
and
state appropriations.
Some items seen in
Table 1 really mean what they say, in a fully exclusive way
(financially speaking).
Thus, the DOE laboratories are fully funded by the U.S. Department of
Energy to
perform certain functions and all that money is spent for the
laboratories. One may note that
there is substantial interaction between Lawrence Berkeley National
Laboratory
and the UC Berkeley campus: some 200 UCB faculty members hold joint
appointments at the lab and many of their graduate students also work
on the
lab payroll. This “synergy” is beneficial to both the lab and the
campus; but
there is no question about their distinctly separate financial accounts.
Another clean example
is the Auxiliary Enterprises: dormitories, dining halls, parking lots,
etc. on
each of UC’s ten campuses. These are described as “self-supporting”
since they
are paid for by fees charged directly to the individuals who use those
facilities. (There are some debates about the finances of
Intercollegiate
Athletics, which comes under this category; but I will not pursue that
issue
here.)
The Medical Centers
(sometimes called Teaching Hospitals) are also described as
self-supporting
business enterprises, although there is substantial flow of personnel
and funds
between the hospitals and clinics and the Medical Schools on the
campuses. It
is customary for the official UC budget to have distinct sections about
Health
Sciences (HS) Instruction and General Campus (GC) Instruction. This
separateness, between the HS and GC sectors, has been memorably
identified by
the UC Office of the President (UCOP) in responding to suggestions for
meeting
the University’s budget crises: “A federal grant for laser beam
research
can’t be used to fund a deficit in the English Department. A payment
for a
surgery in a UC hospital can’t be redirected to fund graduate students.” [UCOP, “The UC Budget: Myths &
Facts,” April
2009].
The category of
Research expenditures, shown in Table 1, covers work sponsored by
external
agencies and some internal budget funds dedicated for specific research
projects; 87% of those funds are Restricted, meaning that they cannot
legally
be used for purposes other than originally intended.
It turns out that the
most complex category is Instruction; and so I start by taking this
apart into
several specific sub-categories.
To do this, I rely on the extensive set of accounting reports
called “UC
Campus Financial Schedules” (CFS), which may be found at http://www.ucop.edu/financial-accounting/financial-reports/index.html. This shows us expenditures, campus by
campus, and even department by department, where each of the categories
shown
in Table 1 are broken down into further details.
II. Review of the Method
That expenditure
category called “Instruction” contains several things that one would
want to
separate out if the object of your study is to find out how much the
institution actually spends for undergraduate instruction. It includes
all
salaries and benefits paid out to all regular faculty members
throughout the
academic year, plus the cost of supporting staff in the academic
departments. This bundle of costs
used to be called the I&R (for “Instruction & Research")
budget.
This
accounting category called “Instruction” even includes an enormous
amount of
money taken in by the clinical practice of medicine and paid out to the
faculty
at the Medical Schools. So, our
first step will be to put aside all the expenditures for all the Health
Sciences (which do involve graduate student programs, but not
undergraduate
programs); and then we also put aside the largest of the other graduate
Professional Schools – those in Law and Business/Management.
This leaves us
with the wide array of academic departments that have both
undergraduate
programs and graduate programs. But there is still one major problem:
the
accounting habits of research universities obscure the fact that
professors are
hired to perform research as well as teaching and simply record the
totality of
their academic year salaries as expenditures for “Instruction.” (The
phrase
“Departmental Research” is used to cover that deceptive practice.)
My approach,
following the classical method called Activity Based Costing, relies on
a
Faculty Time Use Survey conducted by UC a number of years ago. As described in detail in the previous
paper, that analysis leads to the result that 21% of professors’ work
time, on
average, may be fairly allocated to the mission of undergraduate
instruction;
the rest is apportioned to research, graduate instruction, and some
professional service activities (which are mostly tied to the research
endeavor.)
In what follows, I
will first dissect the expenditures for Instruction (to get the direct
cost of
undergraduate instruction), then dissect the category Academic Support
and add
in Student Services as supporting costs for undergraduate education;
and then
finally I add in overhead costs from IS and OMP. For more details on
these
calculational procedures, see the previous paper from 2007.
III. The Updated Calculation
Instruction.
The total UC expenditure for Instruction,
in fiscal year 2011-12, is $4,571
Million. From this we subtract: $298 Million for University Extension
and
Summer Session; $1,853 Million for Health Sciences; $301 Million for
Schools of
Law and Business/Management; and $144 Million for other expenditures of
Restricted funds. This leaves us
with an Adjusted Cost for Instruction of $1,975 Million.
To get the
Undergraduate Instruction part of this we first separate out the
amounts spent
on Lecturers (1857 FTE @$75,000, 81% for undergraduates) and Graduate
Student
Instructors ($156 Million, 87% for undergraduates). The remainder is
then
multiplied by the factor 0.21 and we arrive at,
Academic
Support.
Expenditures for Academic Support:
Libraries ($260 Million - $32 Million Restricted); Other Academic
Support
($1,552 Million - $1,018 Million for Health Sciences, $56 Million for
Law and Business and $40 Million Restricted = Adjusted $438 Million).
Allotting
½ of the former and ¼ of the latter to undergraduates,
Student
Services. From the total expenditure for
Student
Services ($710 million), I subtract the $231 Million spent for Student
Health
Services (paid for by other fees) and another $45 Million of Restricted
funds,
giving us,
Overhead. Total
expenditures
for
Institutional
Support
plus
Operation
and Maintenance of Plant amount to $775 Million + $540
Million =
$1,315 Million. If I spread this
cost evenly over all UC expenditures, I get an effective overhead rate
of
1315/22142 = 6%. In the previous
calculation, I reduced the denominator of this fraction by the amount
spent by
the Medical Centers, assuming that they paid for their own “overhead”
services:
that gives an effective overhead rate of 1315/(22142 – 6366) = 8%. I am
not
sure which method is correct, so I’ll use the figure 7%.
To this I might add
the capital cost, estimated from the reported amount of Depreciation
and
Amortization, $1,477 Million, less the amount already counted by
keeping in Expense
Capitalized, $748 Million. If I
allocate this cost uniformly over all expense categories, it amounts to
another
3% to 5% overhead.
IV. Final Numerical Cost Results for FY
2011-12
Adding the
contributions from Instruction, Academic Support and Student Services
(79% for
undergraduates), then adding 11% of that sum for overhead, we arrive at,
In addition, we can
do something that was simply ignored in the previous study: identify
the
residual portions of the costs from the I&R bundle. That would
represent
the total UC cost for faculty research (unsponsored) plus graduate
student
programs that are closely tied to that research mission.
If we combine these
two separate costs and add in the costs noted earlier for Law Schools
and
Business Schools (with appropriate overhead), we come to a total GC
cost of
$3,809 Million. Dividing this by the total GC enrollment for 2011-12 we
get an
average per student cost for the whole GC I&R bundle at about
$17,100 per
student. This figure is very close to what UCOP published as the
Average
Per-Student Cost of Education for 2011-12, about $17,400. This close
agreement
is reassuring. However, we note how misleading UC’s number can be - exaggerated
by
a
factor
of
three -
if people think that their “Cost of Education”
represents the cost for undergraduate education, rather than the cost
of that
much bigger bundle of activities.
Note. In these calculation, neither UC nor I
include any expenditure of student financial aid as a part of the cost
of
education. The data for SFA shown in Table 1 represent funds provided
by
external agencies (81% from the Federal government); and most of those
are
Restricted funds and thus represent no operating cost to UC. A closer
look at
fees and financial aid comes next.
V.
Per-Student Costs compared to Student Fees
On the basis of their
Education cost figure, UCOP says that student fees (net of financial
aid) now
cover 49% of the cost of education.
Dividing my Undergraduate Education cost figure by the number of
undergraduates enrolled (187,566), we find,
Since the
average
mandatory fees for resident undergraduate students in 2011-12 was
$13,181, I
would say that resident undergrads were being charged 191% of the
average
actual cost for UC to provide their education!
However, this is not a correct comparison because UC uses net
student
fees (after deducting a portion for financial aid) and I use gross
student fee
levels. One can (roughly) convert from gross to net by using a factor
2/3, and
this gives us a choice of two fair comparisons:
UCOP says
Student Fees
(net) cover 49% of their cost and I say it is 127%.
UCOP says
Student Fees
(gross) cover 74% of their cost and I say it is 191%.
Either way, there is
a huge discrepancy, due to our different methods for calculating the
Cost of
(Undergraduate) Education: my method is reasoned and fair (while
details are
subject to debate) while UC’s method is manifestly false and misleading.
Another way of
putting this result: Undergraduate students now pay (even more than)
the full
cost for undergraduate education provided by UC. The State of
California now
pays for no part of undergraduate education at UC and it pays for only
a
portion of the cost of faculty (unsponsored) research and related
graduate
programs.
VI. Discussion of the Implications
of these
Results
A few years ago I
filed a formal whistleblower complaint with the University’s Office of
Ethics,
Compliance and Audit Services, alleging that top UC executives were
issuing
false and misleading information – specifically on this question of the
cost of
undergraduate education – and that this constituted fraud under laws
prohibiting improper governmental activity. In response, I was told
that their
method of calculating the per-student cost of education is promulgated
by the
National Association of College and University Business Officers
(NACUBO) and
has been endorsed by the higher education community.
I charge that the
practice of research universities hiding the true cost of faculty
research
under the rubric of undergraduate instruction is false and misleading;
and the
official response is that everyone else does it, so therefore it is ok.
That organization
NACUBO convened a special committee some years ago to decide how best
to
calculate the institutional Cost of Undergraduate Instruction and
communicate
that to the public. Their 2002 report contains an explicit discussion
of this
very issue: “NACUBO concluded that all departmental research costs
should
remain within instruction.” That accounting rule makes sense at any
college
where the sole mission is undergraduate education, but I challenge
anyone to
justify that for a research university today.
There was a time when
that bundling of costs could be justified as causing no harm. When the
state
paid for the entire cost of the core budget (covering I&R), one
could say
that both teaching and research were seen as “public goods” and paid
for by
public money; so there was no harm in bundling them all together. Over the last two decades, however,
there has been a fundamental shift in how our public universities are
funded:
there has been marked decrease in state funding and marked increase in
student
fees (tuition) – most of which is paid by undergraduate students. This
shift
has been accepted with a change in philosophy that says undergraduate
education
is a “private good” since it leads to economic benefits for those
students.
That shift ought to call forth a change in the accounting habits; but
no such
thing has occurred. Isn’t academic research still a “public good”?
Consider this
statement from the head of the Howard Jarvis Taxpayers Association,
published
July 5, 2010: "As California faces an unprecedented budget crisis,
students at California colleges have been asked to pay a greater share
of the
total cost of their education, most of which is still borne by
taxpayers.
...[T]axpayers pay 60-70% of the cost of ... UC students' education,
without
even counting financial aid." They got their 60-70% number from UC
officials saying that student fees covered 30-40% of the cost of
education.
This is evidence of the harm caused by that bad accounting habit.
This is not just a
California problem. That bad old accounting habit of hiding the cost of
core
research, and thus misstating the true cost of undergraduate education,
infects
every research university, both public and private, throughout the
country. It
is a huge failure of leadership in higher education not to acknowledge
and
correct this problem.
The most obvious harm
is that it invites continuing escalation of tuition and the
consequences in
terms of hindered access and mountainous student debt.
One can also see sad distortions in the
way that our leaders address their financial problems.
Coming out of the
year-long study by the UC Commission on the Future was a set of
recommendations
to decrease the cost of undergraduate education; they never even
mentioned that
the cost of research was the larger problem.
We have heard lots
about the call for increased online education as a way to decrease the
cost of
undergraduate instruction; but that is not UC’s main cost problem.
We have heard a lot
about increasing enrollment of nonresident undergraduate students
(which brings
in more money). This tick’s off California taxpayers who feel that
their own
children’s access to UC is being closed. UC officials reply that they
only
admit nonresidents to fill “unfunded” seats. But since every
undergraduate
student now pays more in tuition than it costs UC to provide them a
seat, there
are no “unfunded” seats.
So this is a big
mess. Who is responsible? At the
top of any great university’s governance there is a Board of
Regents/Trustees/Governors. It is
likely that many of those people are just incompetent – although the
reason
those people [usually big successful business magnates] are there is to
provide
sensible business guidance to the academic world. It is more fitting to
blame
the top level of academic administrators – Presidents and
Vice-Presidents,
Chancellors and most Vice-Chancellors – who know very well about the
lies and
distortions and the funny-money games that are being exposed here.
_
_ _ _ _
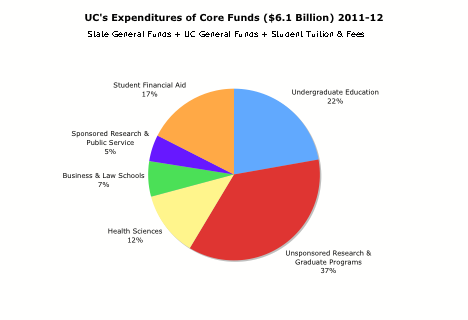
In recent years UCOP
has promoted the concept of “Core Funds” in its budget documents. These are defined as revenues from
State General Funds (37%; state appropriations) and UC General Funds
(13%:
mostly Nonresident Supplemental Tuition + a portion of Federal Indirect
Cost
Recovery) and Student Tuition and Fees (50%: gross
revenues
from
Tuition
+
Student
Services Fees +
Professional Degree Supplemental Tuition).
This
is
from
page
S-15
of
the
latest Regents’ Budget:
the University’s core
instructional and research
programs still rely primarily on the combination of State funds and
tuition and
fees. These core funds remain the foundation of UC’s academic program.
Fully
97% of ladder-rank and equivalent faculty, for example, are paid on
core funds.
Using
the
methods
described
in
this
paper,
I have constructed the following (approximate)
picture
of how those Core Funds were spent in FY 2011-12. This
sort
of
information
has
never
been published before.
INVITATION
I sent a draft of this paper to a number of colleagues, asking for their comments and criticisms. The responses led me to decide that a follow-up paper will be needed to explore a number of important issues. So, Dear Reader, since you have read this far, please accept my invitation to send me your own questions and challenges.