Background
Police cars mounted with automatic license plate readers (ALPRs) are always winding their way through the streets of Oakland. The cameras are recording the plate numbers of vehicles in the front and behind, as well as collecting footage on the surrounding areas. The policy of the Oakland Police Department (PD) is to utilize ALPR technology to capture and store digital license plate data and images in order to track stolen vehicles, monitor hit-and-run cases and record suspicious activity. Each morning, before the patrol gets into the car, they receive a “hit list” of plate numbers that are loaded into the readers and fires off an alert if any number matches plates of vehicles on the street. In the revised policy, Oakland PD has established a retention policy of 6 months, after which records will be destroyed.
In a 2012 report, American Civil Liberties Union (ACLU) identified that less than 1% of the data collected using ALPR technology matched the “hit list”. This poses an important question: what is being done with our sensitive, private location information? The technology is automated, but a retention policy of up to 6 months means public agencies like the Oakland PD can put together pieces of location information. This reveals personal information such as political or political associations that can be abused and breaches privacy laws.
Data sources
The data collected for this analysis was received as a result of public records request, leading to the release of over 2.7 million readings between 2010 and 2014 in Oakland Open Data. Additional data sources include American Fact Finder (race and income) and Oakland Police Department’s Crime Data. The following visualizations should provide more insight into how plate numbers are being collected, what neighborhoods are disparately targeted and further analysis on causality.
An overview of ALPR records
Mapping the raw data of ALPR readings over time reveals specific neighborhoods encountered more surveillance than others, as seen in the image below. The heatmap provides an overview of neighborhoods with repeated surveillance by plotting the raw readings against time (between 2010 and 2014) and number of records collected monthly.
Creating a time stamped graph of ALPR readings
The finding gets more interesting as we gauge deeper into the data. I aggregated the number of license plate readings per day and plotted it against time to show the trend.
The flat lines on the time axis showing zero readings corroborate to missing data in the released records. The data retention policy cited earlier was only recently determined by Oakland PD, until which point all the data was recorded and retained infinitely. I spoke to Mike Katz-Lacabe from the Center for Human Rights and Privacy, and a well-informed privacy expert from the Bay Area to understand the piece about missing data. He explained to me how the lack of a defined retention policy meant data was being stored in external hard drives and damaged. There is a possibility that Oakland PD was not able to release the records because the data is lost.
We can see from the time stamped graph the are tallest spikes are in August 29, 2012 and August 2, 2014. Once we dive deeper into the data, we can find out if that corresponds to an important political event, which could point to why more records were collected during certain time periods.
Analyzing disparate surveillance on racial groups
In the second part of the analysis, I tried to find out if minority groups, such as African-Americans and Hispanics are being disparately targeted. This means there will be more patrol equipped with ALPR technology in neighborhoods with higher percentages of the African-Americans or Hispanics. In order to make the analysis accurate, I normalized total readings in a given neighborhood by population. This becomes tricky because neighborhoods near Oakland Airport for example, will have a lower population and a high number of records owing to the fact that surveillance technology is historically more prevalent near and inside airports. This makes the processed data slightly inflated and not necessarily always useful in making calculated assumptions about what is actually happening. The data nevertheless should not be entirely discounted. The map shows areas like Downtown Oakland having a higher intensity of ALPR records which is accurate given it is a central location.
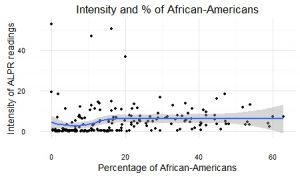
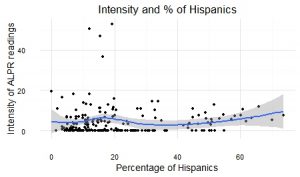
To understand the implication of surveillance technologies such as ALPR, we dived deeper into the data and mapped records on two minority groups, Hispanics and African-Americans. When compared with percentages of African-American or Hispanic population, we find areas such as Oakland Airport have high concentrations of African-American population and high ALPR intensity. Deriving any positive correlation between readings and concentration of racial groups can throw us off; the intensity of ALPR is misleading. In addition to more surveillance technology, the high intensity of readings near airports can be explained by the fact there are more vehicles near the airport. On the other hand, neighborhoods with high percentage of Hispanics show relatively high intensity of ALPR readings consistently, ranging between 0.4 to 7.0 units.
In order to draw a statistically significant relationship, I plotted the intensity of ALPR readings against the percentage of Hispanics and African-Americans in the population. Contrary to what the maps showed, the graphs did not reveal any significant correlation.
Understanding disparate surveillance on low-income households
A similar comparison can be drawn between the intensity of ALPR readings and household income. Temescal and Oakland Airport are both low-income areas with two of the highest brackets in ALPR intensity. In San Leandro, Castro Valley and Lakeshore, where 12-18 percent of households have an annual income of over $200,000 have lower intensity of ALPR records. Cyrus Favrier, senior business editor at Ars Technica resonates my finding in his investigative report from March 2015. He refers to over 4.6 million records collected between the same time frame as mine where patrol cars mounted with ALPRs were seen more frequently in low-income neighborhoods.
Correlation between crime rate and ALPR readings
When Oakland PD’s crime data is mapped and compared against the intensity of ALPR readings, it is seen that low-income neighborhoods are also hotspots for crime, which explains why there is more police patrol in these areas. Because ALPR technology is mounted on police cars and pre-loaded with a ‘hit list’, it is not unlikely that there is an assumption areas with a higher crime rate will have a greater chance of matching license plate numbers with missing vehicles.
Conclusion and Next Steps
While the analysis has provided depth in insights and understanding of ALPR technology, it has however not shown any causality between ALPR readings and racially discriminated groups or low-income populations. There is some correlation, but it is too early to attribute it to implicit bias and disparate surveillance.
The missing data piece in ALPR readings because of damages to the hard drive makes it challenging to draw concrete conclusions. In the next round of analysis, it will be interesting to assess the number of vehicles on the road with ALPR readings or potential national security threats following particular events to understand the causality between number of records with other factors.