
San Francisco Bay Soil Liquefaction Hazard and Population Analysis
-This report was completed for the City Planning 255 Final Project-
Introduction
In California, which is located on the tectonically and volcanically active Pacific Ring of Fire, millions of people are unaware of the immense natural forces in the area. Large, active faults cut across the state from Mexico to Mendocino and are gradually slipping until the next Big One. In the San Francisco Bay Area, many of these fault zones converge and present a potential for large amounts of shaking from several distinct and possible events. While this can present exciting opportunities for Earth scientists, it also causes serious hazards for current and prospective residents of the Bay Area.
The analyses and maps created for this project were made with the goal of informing Bay Area residents and business owners of the hazard posed by soil liquefaction and providing informative data visualizations on the distribution characteristics of the large earthquakes that can cause liquefaction. Additionally, two maps for looking up specific addresses–and finding where they fall on a liquefaction hazard map–are useful tools for current and prospective residents of the Bay. These maps present the maximum liquefaction scenarios for the East Bay and San Francisco and map of the impact of potential events–providing an interesting and informative comparison for interested residents.
Motivation: Soil Liquefaction Hazard
A primary form of possible destruction during an earthquake is soil liquefaction. During the intense and cyclical shaking of a high-magnitude earthquake (generally considered to be 6.7 M or greater), partially saturated soil loses much of its cohesive strength and stiffness and begins to act like a liquid. For buildings, roads, railroads, and other human-build structures on top of liquefaction-prone soils, this presents a major hazard, as loose soil acts like quicksand and compress under an applied load. After the 1964 Niigata earthquake (photograph A) below), increased attention was brought to civil engineers and building codes were updated for homes and businesses, but significant hazard remains.
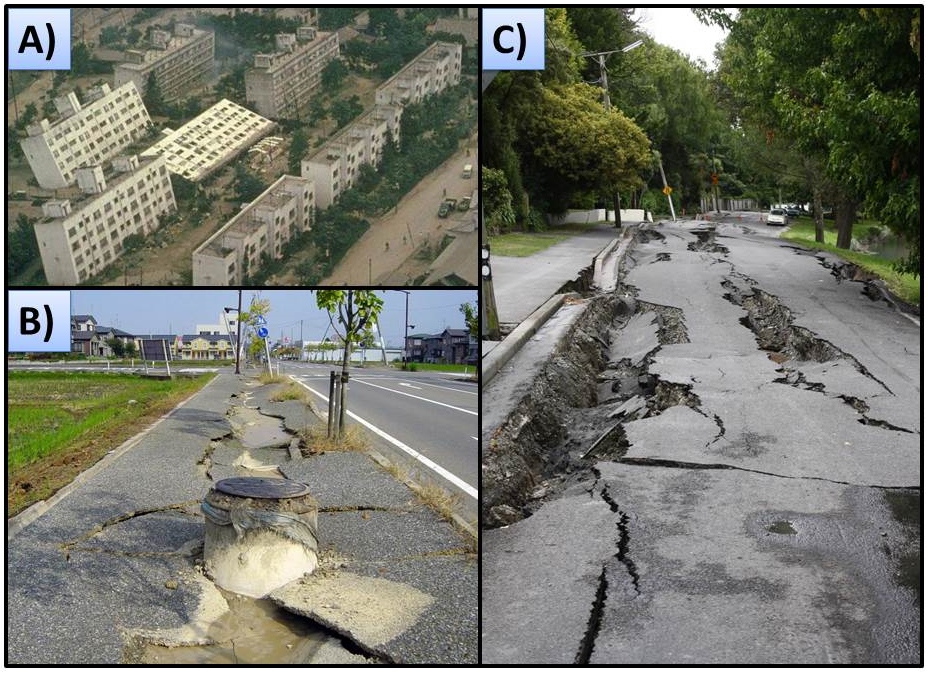
Photographs of liquefaction causing destruction to human structures. A) Toppled buildings and destroyed towns cuased by the 1964 Niigata, Japan earthquake brought attention to the engineering challenges of building in earthquake -prone areas. B) Damage to road and sidewalk from the 2004 Chuetsu, Japan earthquake, and C) damage to roadways from the 2011 Christchurch, New Zealand Earthquake presented literal roadblocks to rescue and rebuilding efforts. Note preferential destruction of sidewalk compared to the road in B. [Image source: Wikipedia.org]
During the 1989 Loma Prieta earthquake, liquefaction destroyed much of the Marina District in San Francisco. Despite updated building codes since the 1964 and 1989 events, many residential and industrial workplace buildings that border the Bay and are built on loose sediments or landfill predate these reforms. Because of this, soil liquefaction still poses a significant threat to buildings and infrastructure in the Bay Area and is a necessary consideration for people in the highly-competitive Bay Area housing market.
Data
Both the census data and the two sets of liquefaction data were downloaded as ESRI shapefiles and converted in Quantum GIS to CSV files for python statistical analysis and to GeoJSONs for loading to CartoDB, for the interactive maps. The shapefiles represented large amounts of data that were difficult to handle in CartoDB (along with the data cap for free users) and python, so only summary statistics were computed. The earthquake data was downloaded from the USGS as a CSV and analyzed and visualized with python using a iphython notebook in jupyter.
Bay Area Population
The population of the Bay Area is spatially heterogeneous, as represented in the interactive maps below. The summary statistics for the analyzed data columns in the census data-set demonstrate the variety of data values and shed light on how each property was calculated. Because the land area for the census blocks is not consistent from block to block and has topology based on what can be fit to an area, it is not useful for statistical analysis. The total population, population density, and diversity values, however, can all be used to generate spatially meaningful plots. The diversity data have significant, much larger outliers due to the way they are calculated, but that is a very small percentage of the data and the diversity values can’t be removed without affecting other columns.
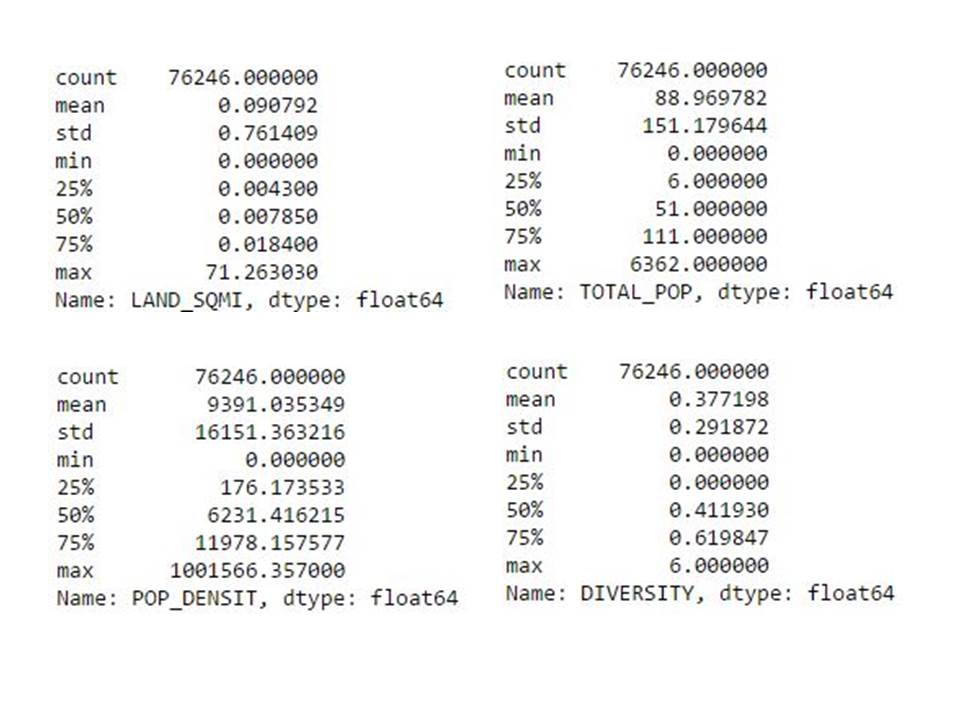
Summary statistics for the Bay Area Census data.
Earthquake Data
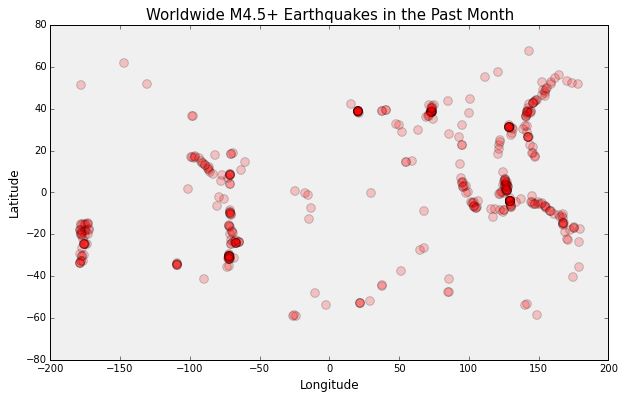
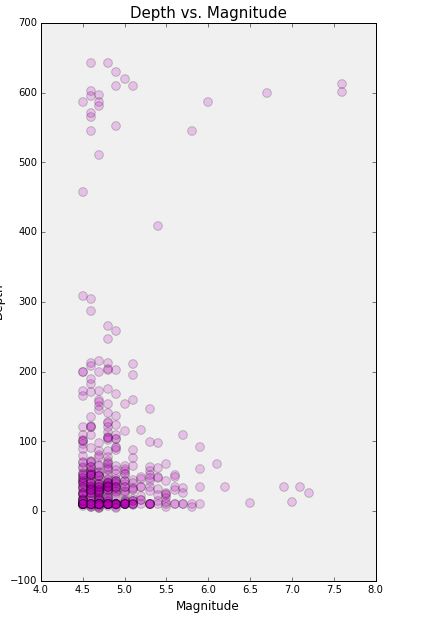
In addition to the interest in the population of the Bay Area, data on large earthquakes themselves are informative when dealing with liquefaction. For this analysis, one month of M 4.5 and greater earthquakes were downloaded from the USGS and analyzed for trends. The first plot is the location of these earthquakes across the globe. The majority of these events can be seen to have occurred in the southern Pacific, with very few on the west coast of the United States. The second plot is a Depth vs. Magnitude plot. In California, the strike-slip faulting will occur at relatively shallow depths, where most of the data is clustered in this lot.
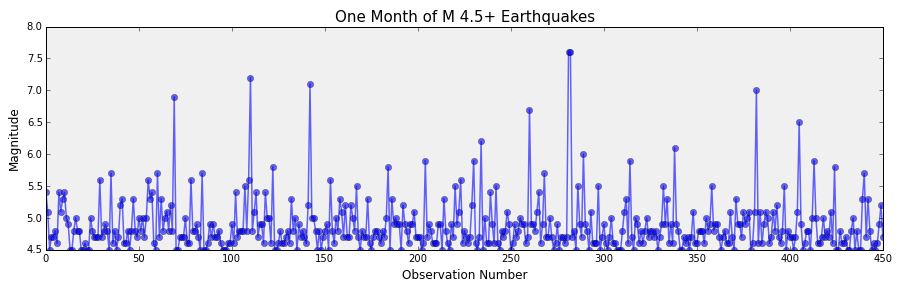
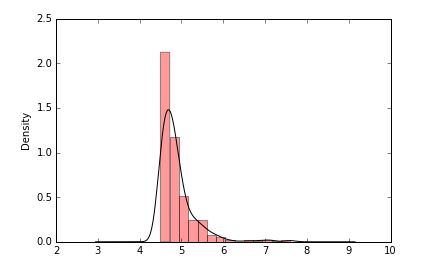
The third plot is a representation of the magnitudes of the earthquakes, evenly spaced by observation number, over the month. The distribution of M 6.7 can be seen to be widely spaced, indicating their relative rarity and non-clustering temporally. The last plot is a histogram of earthquake magnitudes (for only those over 4.5 magnitude), overlain with a Kernel Density Estimate, which represents the distribution of magnitude events as being close to a normal distribution.
The two scenarios used in the interactive maps below are the a M 7.0 earthquake on the entirety of the Hayward fault for the East Bay worst case, and a M 7.8 earthquake on the San Andres fault for the San Francisco worst case. These scenarios correspond to the two most likely faults to move in the Bay Area and produce a greater than 6.7 Magnitude earthquake (predicted 31% and 21% respective probabilities in the next 30 years, based on the UCERF3 forecast). The magnitudes were chosen by the Association of Bay Area Governments (ABAG) and were based on the methodology used in 1995 by the Working Group on California Earthquake Probabilities (WGCEP), as described by Witter et al. (2006).
Interactive Web Maps
A major product of this final project, and the City Planning 255 course in general, are interactive maps, two of which are presented here. These maps allow residents and business owners to search for addresses and find their census information and visualize where they lie within the soil liquefaction regime of the Bay Area. For the liquefaction data, hazard values range from almost no liquefaction for “Minimum” areas to over 73% for “Maximum” areas, with nearly 66% of total liquefaction to occur within just the high (73% liquefaction) and very high (38% liquefaction) hazard areas. While this represents a high localization of liquefaction hazard, over 25% of the Bay Area’s population lives within these zones.
Acknowledgments
I would like to thank Professor Paul Waddell and Graduate Student Instructor Geoff Boeing for their instruction during City Planning 255. Taking this course was a great experience and I learned my way around several useful tools I have already begun using for other projects, and gained a significant appreciation of how open urban data access and analysis can be an important and change-inducing tool for our cities.
References
The REAL Dirt on Liquefaction: A Guide to the Liquefaction Hazard in Future Earthquakes Affecting the San Francisco Bay Area—Jeanne B. Perkins, ABAG
Maps of Quaternary Deposits and Liquefaction Susceptibility in the Central San Francisco Bay Region, California, USGS Open-File Report 2006-1037—Witter et al.
Earthquake Probabilities in the San Francisco Bay Region: 2000 to 2030—A Summary of Findings, Open-File Report 99-517—Working Group on California Earthquake Probabilities (WGCEP)
Uniform California Earthquake Rupture Forecast, Version 3 (UCERF3), USGS, 2013
Data
Association of Bay Area Governments (ABAG) Resilience Program–Liquefaction data
Alameda County Government–partially cleaned census data
US Census Bureau, through bayareacensus.ca.gov–more complete census data
USGS [earthquake.usgs.gov]–Earthquake data