Crude-oil based petroleum products are still the main source of energy used in the US, and California continues to be one of the main contributors to the oil and gas industry today. In 2016, California was ranked the third highest domestic petroleum producer, excluding federal offshore areas, and in 2017, ranked third in oil refining capacity. The state produces around 2 million barrels of oil each day–42 US gallons per barrel–through its 18 refineries in the Bay Area, Los Angeles Area, and Central Valley (California Energy Commission).
However, being a major oil manufacturing and refining hub comes as a cost. According to the California Emission Inventory Development and Reporting System (CEIDARS) database provided by the California Air Resources Board, refineries and terminals emit the highest amount of toxic chemicals annually out of any facility in the state. A study comparing the air quality of refinery communities to nearby rural areas showed that the refinery communities had 33 percent more toxic compounds and four times more endocrine disrupting chemicals than its surrounding communities (Brody et al., 2009). The authors also suggest that not only are refinery communities exposed to higher levels of toxic pollutants, but the combination of all of these compounds creates an even more dangerous air pollutant composition that can trigger numerous adverse health outcomes in those exposed, including asthma.
Given this information, the goal of this project is to address the following research questions:
• Is the air quality disproportionately worse in refinery communities compared to its other communities? This project focuses on Contra Costa County, where there is a high concentration of refineries and terminals that stores and processes petroleum and petroleum products.
• What are the demographic characteristics of these refinery communities?
• Are asthma rates higher in these communities?
California EPA provided data on pollution burden and asthma rates by census tracts in the county. Pollution burden was derived from the average percentiles of exposure indicators including ozone, PM 2.5, diesel PM emissions, and toxic release from facilities, and five environmental effects indicators including hazardous waste facilities and generators. The environmental effects indicators were given half the weight of exposure indicators. Asthma rates were adjusted for age and derived from the number of emergency department visits per 10,000 people that occurred between 2013-2015. The California Air Resources Board (CARB) provided the CEIDARS database that contains information on the amount of criteria pollutants (total organic gases, reactive organic gases, oxides of nitrogen (NOx), oxides of sulfur (SOx), and particulate matter) emitted by facilities in Contra Costa County in 2015. The CEIDARS database indicated that even though refineries emit higher amounts of criteria pollutants annually compared to terminals, terminals still emit higher levels of pollutants than all other facilities in the county. Therefore, terminals were also included in this analysis. Data on demographic and income characteristics was collected through American Community Survey from 2011 to 2015. Google Places API was used to geocode the location of each refinery and terminals in Contra Costa County.
In order to assess asthma rates in refinery communities, distance from each census tract centroid to the nearest facility was calculated using the Distance Matrix tool in QGIS. The results were then included in a regression model to determine the relationship between distance to refineries and asthma rates.
Map 1. Pollution burden by census tract in Contra Costa. Refineries and terminals are clustered in Richmond and Concord-Martinez. Each clickable marker shows the name of the facility.
The CEIDARS database showed that refineries and terminals emit the most criteria pollutants (carbon monoxide, lead, nitrogen dioxide, ozone, particulate matter, and sulfur dioxide) annually out of all facilities in the county, and therefore poor air quality is expected in these regions. This prediction is supported by Cal EPA’s pollution burden data, as the census tracts that either contain or are adjacent to these census tracts have the highest pollution burden (Map 1). There are two additional census tracts without refineries that have high pollution burden in Pittsburg and Elmwood. This is likely explained by the presence of a large chemical plant, Dow Chemical Company, which is also the source of chemicals and pollutants.
Map 2. Census-tract level asthma rates in Contra Costa.
The criteria pollutants emitted by these facilities have been known to trigger asthma. Similar to the pollution burden trends, asthma rates tend to be high in the census tracts that contain facilities or are adjacent to these census tracts (Map 2). Additionally, a census-tract level comparison of median asthma rates in cities with or without refineries/terminals show that census tracts with these facilities tend to have higher rates (Figure 1). However, it should be noted that once again, there is a cluster of census tracts in Pittsburg with high asthma rates. The possible factors contributing to this were not explored in this project.
Figure 1. Breakdown of median asthma rates by Contra Costa cities that have refineries or terminals:
These results suggest that proximity to refineries/terminals could be a predictor for asthma rates, given that asthma rates are higher in refinery communities and higher concentrations of asthma-inducing criteria pollutants would be expected closer to the facilities. A regression model was derived to assess the relationship between distance to facilities and asthma rates (Figure 2). Both asthma rates and distance to facilities were log-transformed to achieve a normal distribution. The resulting model shows a a slightly negative correlation between the two variables, but this would only be a moderate correlation given that the R-squared value is relatively low (-0.23).
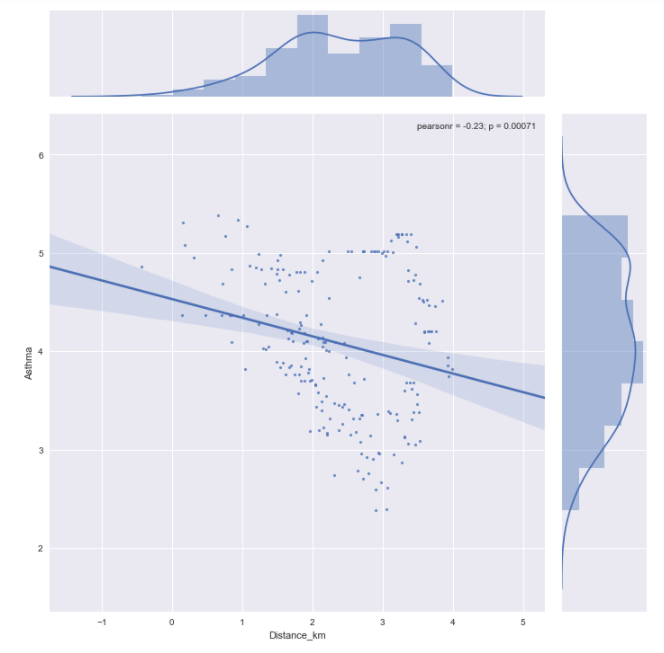
Figure 2. Relationship between proximity to refineries (km) and asthma rates
To further examine what other variables are strong predictors for asthma rates, additional covariates, pollution burden, poverty level, and race/ethnicity, were added to the regression model. Pollution burden and poverty level were also log transformed. The results of the regression indicate that distance to refineries is no longer a significant predictor for asthma rates, while the other covariates are significant (Figure 3). Of all the variables, pollution burden and poverty level are the strongest predictors of asthma rates.
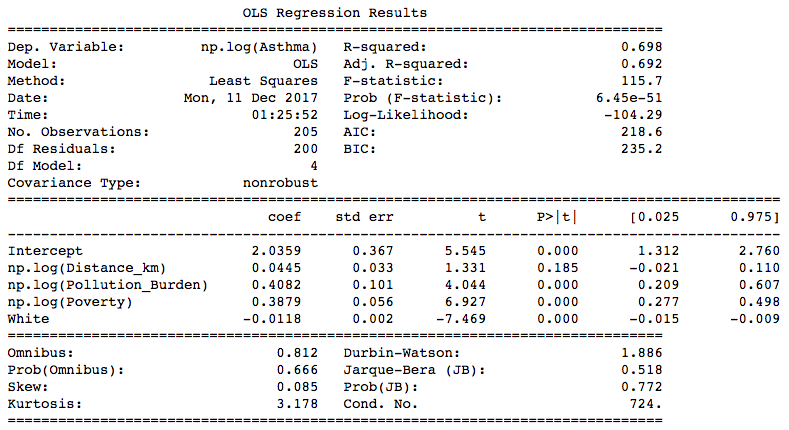
Figure 3. Linear regression of asthma rates and predictor variables
Many of the refineries in the Bay Area date back to the early 1900’s. To comply with federal and state regulations, California refineries have invested approximately $5.8 billion to upgrade their facilities to produce cleaner fuels and reduce emissions. However, a quick look at the asthma rate between 2013 to 2015 shows that there is an upward trend in asthma related emergency department visits for the census tracts that have refineries or terminals.
Figure 3. Longitudinal trends in asthma rates from 2013 to 2015
This suggests that despite efforts for modernization to clean up these major sources of air pollution, asthma rates in these communities are disproportionately high and increasing. A current proposal might allow refineries to process dirtier oil which would result in poorer air quality for these regions and possibly worse health outcomes. The Bay Area has been noted as a place where environmental racism and environmental health disparity exists. Therefore, further research is necessary for policymakers to understand the associations between pollutants and adverse health outcomes to advocate for environmental justice in these disadvantaged communities.
This project had some limitations. First, asthma rates, pollution burden, poverty level, and race/ethnicity data were only available on a census tract level. If individual level health and socioeconomic data or finer-scale air quality data had been available, the relationship between asthma rates and the covariates could have been determined more accurately. Second, the datasets were collected during different time frames and therefore not entirely comparable. Finally, it is likely that other confounders besides the variables considered in this project, or interaction between the covariates, contribute to high asthma rates. However, these were not further investigated.
Really fantastic visual appeal on this site, I’d value it 10 10.
There’s noticeably a bundle to know about this. I assume you made sure good points in options also.
Have you ever thought about creating an ebook or guest authoring on other blogs? I have a blog centered on the same ideas you discuss and would love to have you share some stories/information. I know my subscribers would appreciate your work. If you’re even remotely interested, feel free to send me an email.
Enjoyed reading this, very good stuff, regards.