By Sophie Bandarkar & Barbara de Alfaro

Introduction:
A 2015 Consumer Financial Protection Bureau (CFPB) survey found that 26 million Americans are credit invisible. This means that one in ten adults in the United States have insufficient data to generate a traditional credit score and cannot access the formal financial system. Banking deserts are defined as geographic areas with inadequate banking services, which exacerbate the likelihood of credit invisibility. Across the country, elderly populations and communities of color are more likely to be impacted by banking deserts and resulting credit invisibility.
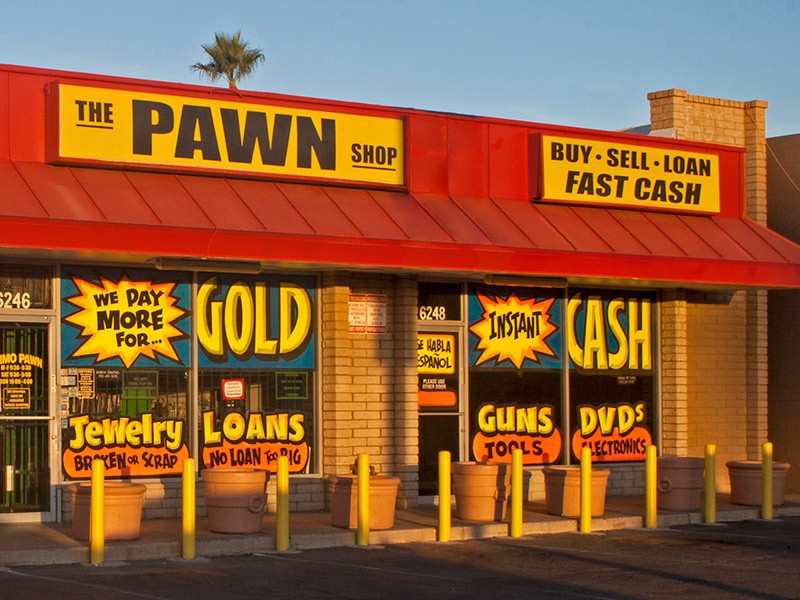
In order to access credit, these individuals often have to rely on predatory alternatives to the formal system, such as non-bank check cashers, payday lenders, or pawn shops, which usually lack consumer protections and are costly for those struggling to make ends meet. In fact, research finds a positive relationship between banking deserts and a high concentration of alternative financial providers. It is important to note that potential borrowers who are credit invisible and have limited mainstream credit options are not necessarily high credit risks, and that advocating for more mainstream low-cost credit options is not the same as increasing high-risk loans, which may ultimately harm both the financial institution and consumer involved.
We wanted to investigate the distribution of this issue across the country and examine other factors that might correlate with high rates of credit invisibility. The Economic Inclusion Survey of the Federal Deposit Insurance Corporation (FDIC) provided us with a large dataset about financial inclusion. Since the dataset is geocoded by metropolitan statistical area (MSA), we had to first aggregate all the geographic IDs in order to visualize the survey responses.
After looking at the distribution of unbanked individuals, we checked to see how it correlated with credit card applications, median household income level, homeownership, mobile phone and internet access, and rates of online and mobile banking. While we were able to effectively discern trends across the United States, our results were limited since we were missing rural data, which has the highest prevalence of banking deserts. We conclude that policy makers and regulators must pursue more ways in which low-cost mainstream credit can be provided to communities of need. In order to do so, they must collect more nuanced geographic data of banking deserts, and examine how it intersects with income, race, age, mobile and internet access, and other economic indicators across rural and urban localities.
Distribution of Unbanked Individuals and Credit Applications
We first looked at the distribution of unbanked individuals, and compared that with the percentage of people who had attempted to apply for credit in the past 12 months. Consumers in rural and low-to-moderate income areas use credit cards as entry products less often than other consumers, which might explain why there were many areas where individuals were unbanked but they did not apply for a credit card in the last 12 months. Particularly, according to the survey, there are many geographic regions in the Midwest and South with a high percentage of unbanked individuals where almost no individuals were rejected from credit in the last 12 months. However, it is important to note that many unbanked individuals do not even have the opportunity to apply to credit in the first place.
American Community Survey: Median Household Income and Home Ownership
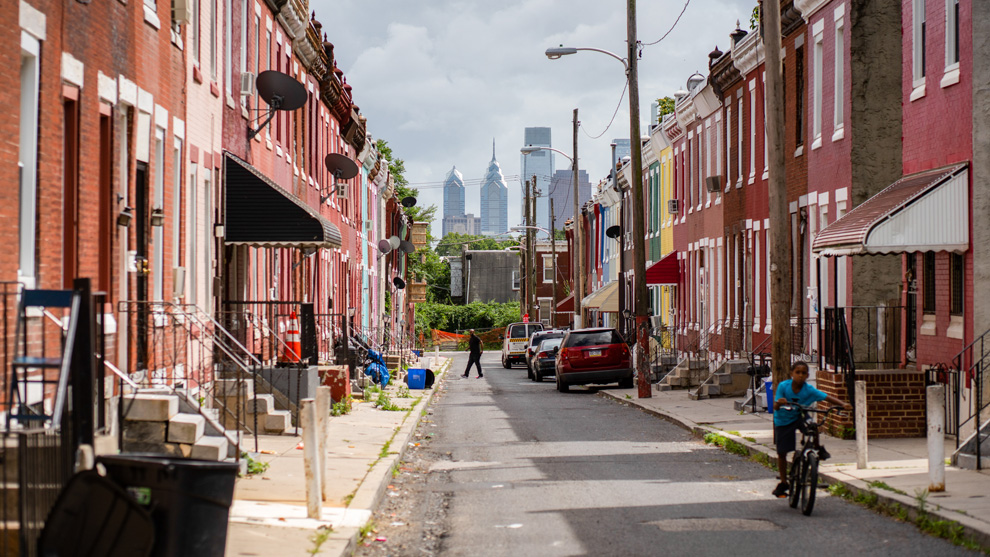
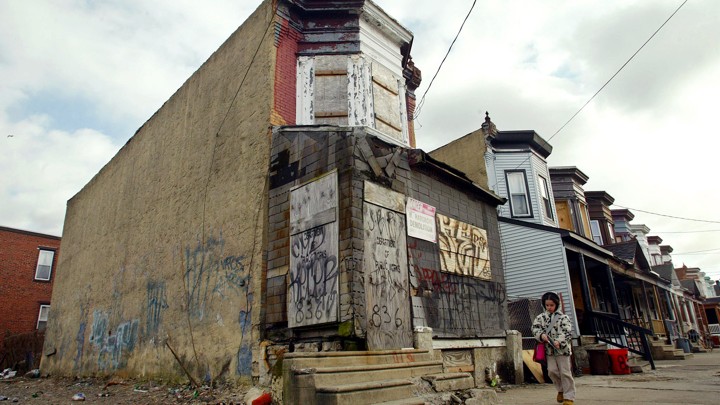
Then, we wanted to see how strongly these proportions correlate with median household income levels across the country. Using the American Community Survey 5-year estimates from 2017, we aggregated the geographic region at the MSA level and mapped median income levels. The two maps demonstrate a correlation between low-income areas (below the $50,000 median household average) and areas with a high percentage of unbanked individuals. However, because median incomes are aggregated at the MSA level, some urban environments with higher median incomes have a significant percentages of unbanked individuals, such as the New York, Philadelphia, and Miami MSAs. This demonstrates the importance of remembering that low-income individuals in urban environments are still vulnerable to credit invisibility, and that data available at the MSA level does not tell the full picture.
Comparing banking deserts with median household income is key, because there are two primary ways that individuals can accrue wealth in the United States: homeownership and owning a small business. Both of these options usually involve accessing credit. Credit bureau data is also being used in an increasing range of applications from auto to tenant to employment screening, which means that credit invisible individuals are often barred from accessing essential services which could decrease household wealth.
As a second indicator for wealth, and to specifically account for wealth generation that is dependent on credit, we also mapped the ACS rates of homeownership across the country. We ran into the same issue with the MSA level information and also had a difficult time accounting for urban environments which are rich but have a high rate of renting because they are very transient, such as San Francisco. But a few areas, like California and the South have low rates of home ownership and high rates of credit invisible individuals.
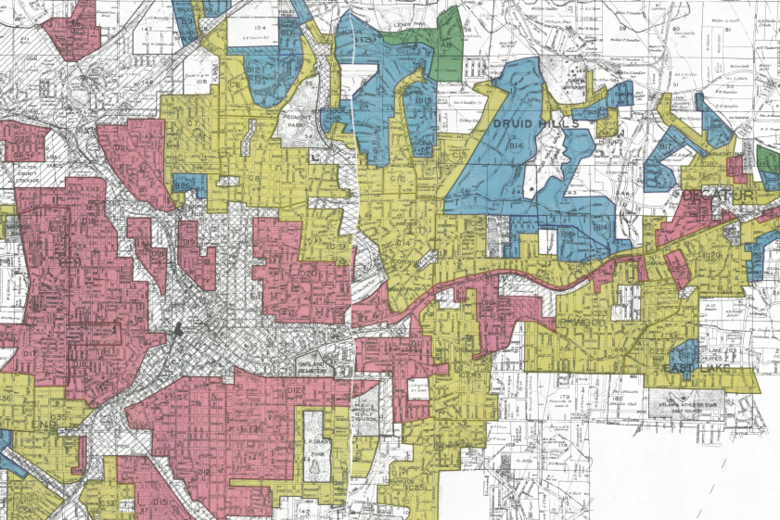
Credit to accessing home ownership is related to the United States’ history of redlining, or the illegal practice under which people living in a certain area were not given the same access to credit as others often based on race, ethnicity, or another prohibited characteristic. Redlining influenced a significant amount of modern-day housing segregation, and is instrumental to understanding credit deserts. The picture below shows a historic map of redlining in Chicago, an area with a high rate of unbanked individuals today.
Internet and Mobile Phone Access
The CFPB found that internet access was more highly correlated with banking access than bank location. Specifically, outside of urban locations there is little relationship between distance to the nearest bank and incidence of credit invisibility. This could imply that credit products which originate through online means and are accessed from internet or mobile phones are more important to combating banking deserts. Policy efforts in financial inclusion prioritize expanding banking to mobile and internet to add more points of entry. Thus, we decided to map access to mobile phones and internet by plotting the amount of individuals in an MSA that responded “no” to having a mobile phone or internet access at home. Our results were slightly skewed, because many people didn’t respond to the mobile access question, but without margins of errors it was difficult to determine the reason behind the low response rate.
Both of these maps show a significant positive relationship between areas that have more unbanked individuals, and who have no internet access and / or phone access. These maps also demonstrate that even in wealthier highly-urban environments, people lack internet access. Around 60% of respondents in poorer MSAs in the midwest and south of the country responded that they did not have access to the internet, which we found to be surprisingly high. While efforts to increase the amount of entry points for credit by creating more varied credit products is important, our maps demonstrate that it is more important to first ensure that everyone has the ability to access these products in the first place.
The Prevalence of Mobile and Online Banking

Finally, we wanted to examine the rise of both mobile and internet banking to see if geographic regions and populations that most need alternative entry points to the formal banking system are being prioritized. As mentioned, financial institutions have prioritized expanding mobile and online services, and improving the customer experience on platforms to encourage greater use. As a result, we were surprised to find such low rates of mobile banking, but it does support research that while mobile banking is on the rise, a vast majority of customers (around 71%) still prefer in person branches and accessing ATMs. The rates of internet banking however, was pretty high (up to 57% in some areas), which affirms our earlier point about internet access.
The maps demonstrate that there is no observable correlation between MSAs with high increases in banking and mobile phones, and areas with high percentages of unbanked individuals. For example, the northwest east coast cities, midwestern, and southern MSAs have relatively low rates of both mobile and internet banking, but are overly represented in percentage unbanked. As a note, when loading out of Carto, California reported having no internet or mobile banking, which does not match the data. As a result, depending on the screen there may be an issue in the way the survey results have loaded.

Conclusion
The primary avenues to economic opportunity in the United States are all tied, to some degree, to the credit score stored in credit bureau’s databases. However, approximately one in ten adults in the United States are credit invisible, and are highly likely to live in banking deserts with little access to the financial system. Our maps demonstrate that they are disproportionately likely to not even apply to formal credit, be below the household median income, and lack access to internet and mobile phones at home. Financial institutions have focused on expanding credit products over the last few years to mobile and internet, but many credit invisible individuals may lack access to those technologies, or access to those credit products as well. Our research was severely limited by the MSA level categorization, and the fact it did not capture rural areas. More geographically detailed research and policy options to encourage financial inclusion are desperately needed.