SB375 was passed in 2008, mandating California metropolitan planning organizations (MPOs) to include a sustainable communities strategy in the land use component of their regional transportation plans. These strategies must identify housing for the region’s projected population and lay out strategies to achieve specific reductions in greenhouse gas emissions (GHGs).
The State’s Greenhouse Gas Cap and Trade program has recently begun funding an Affordable Housing and Sustainable Communities Program (AHSC) to support housing developments near transit. A whole body of recent transportation planning research has been dedicated to the impact of transit-oriented development (TOD) on people’s travel behavior. However, few studies have sought to quantify how locating affordable housing near transit may impact vehicle miles traveled (VMT).
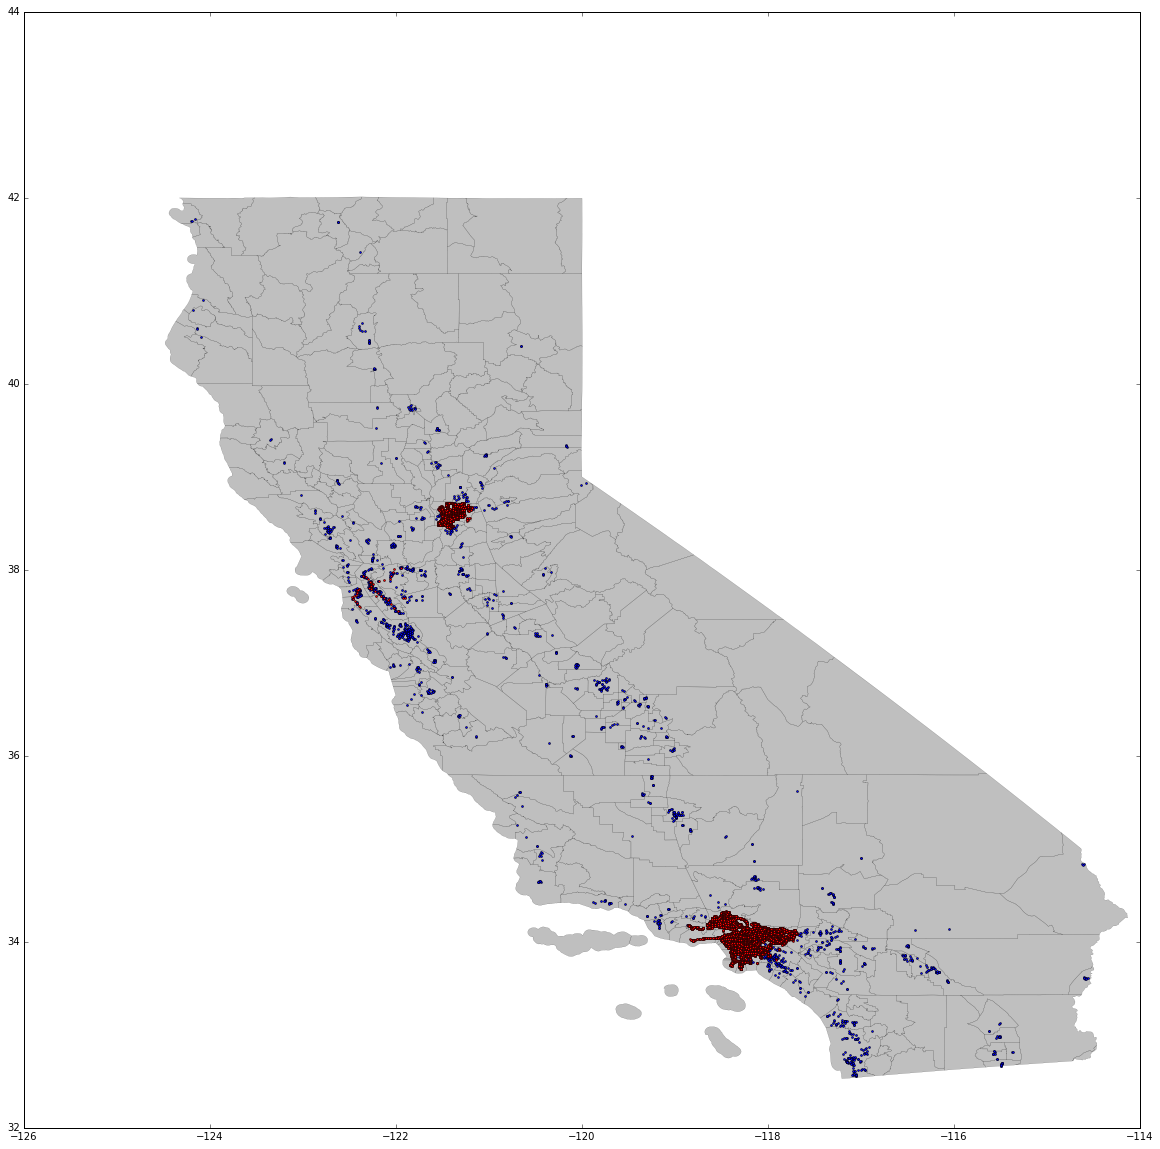
The state map shown here highlights the bus and rail stops for the following regions:
- Sacramento (bus and light rail)
- Los Angeles Metro (bus and light rail)
- BART (heavy/commuter rail)
- Foothill Transit (bus)
The state map below overlays state transit with information from the Low Income Housing Tax Credit (LIHTC) database of developments in the state that have received HUD funding. This dataset has been truncated to include only developments with 50+ low-income units.
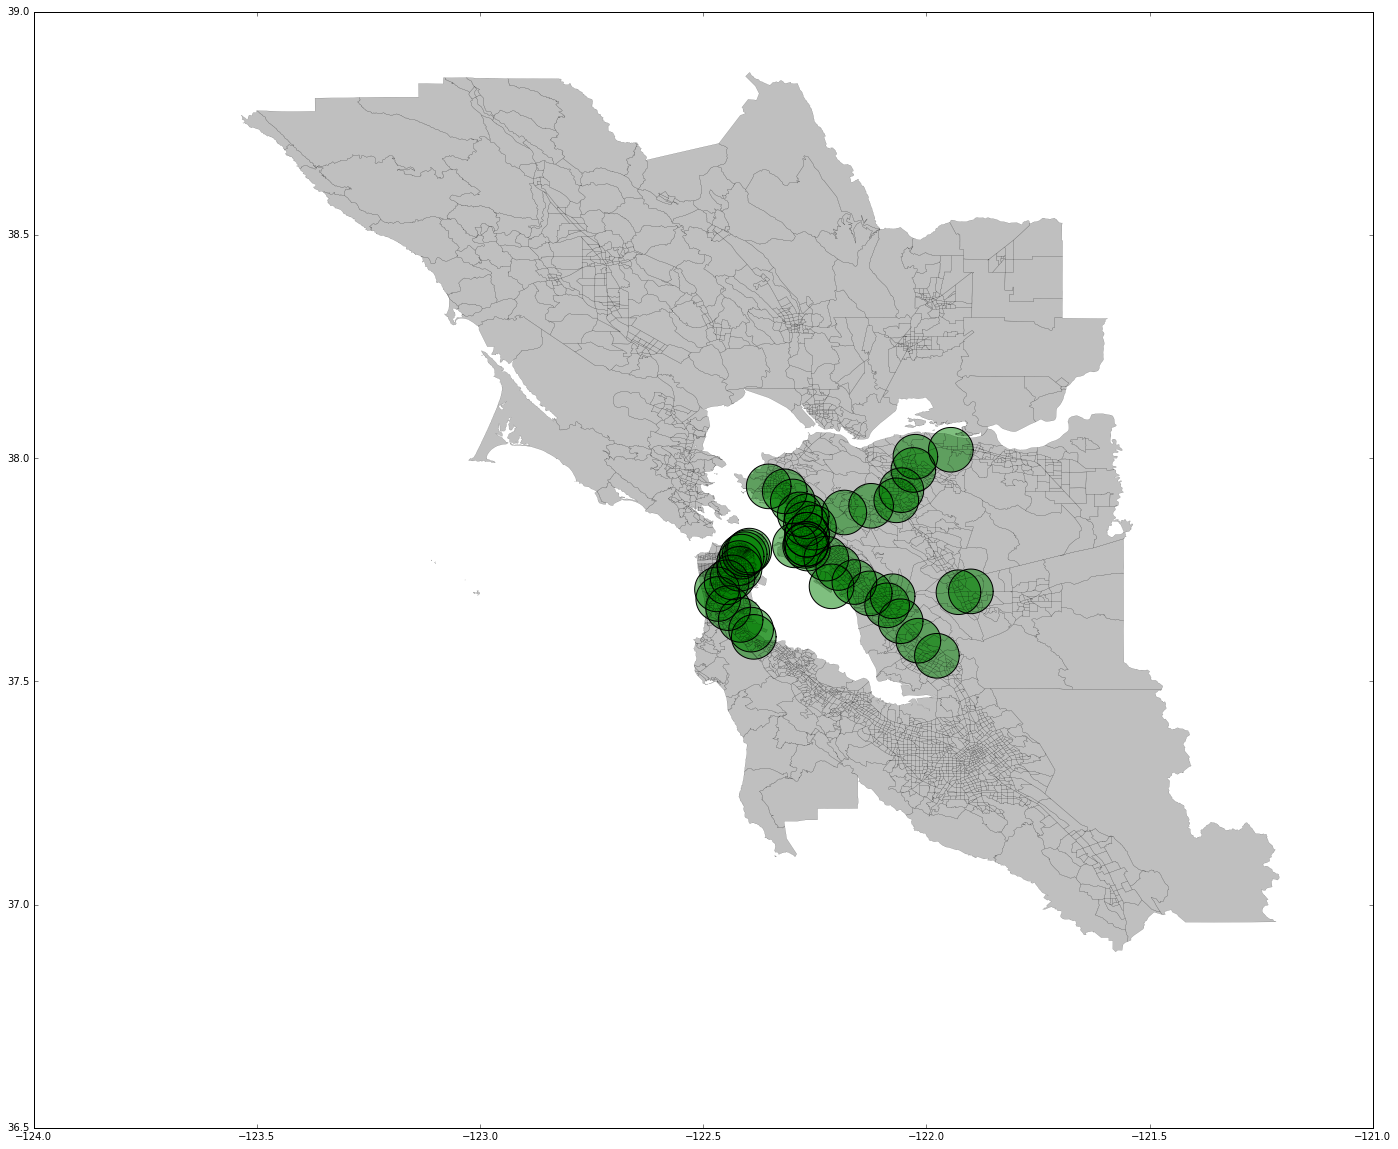
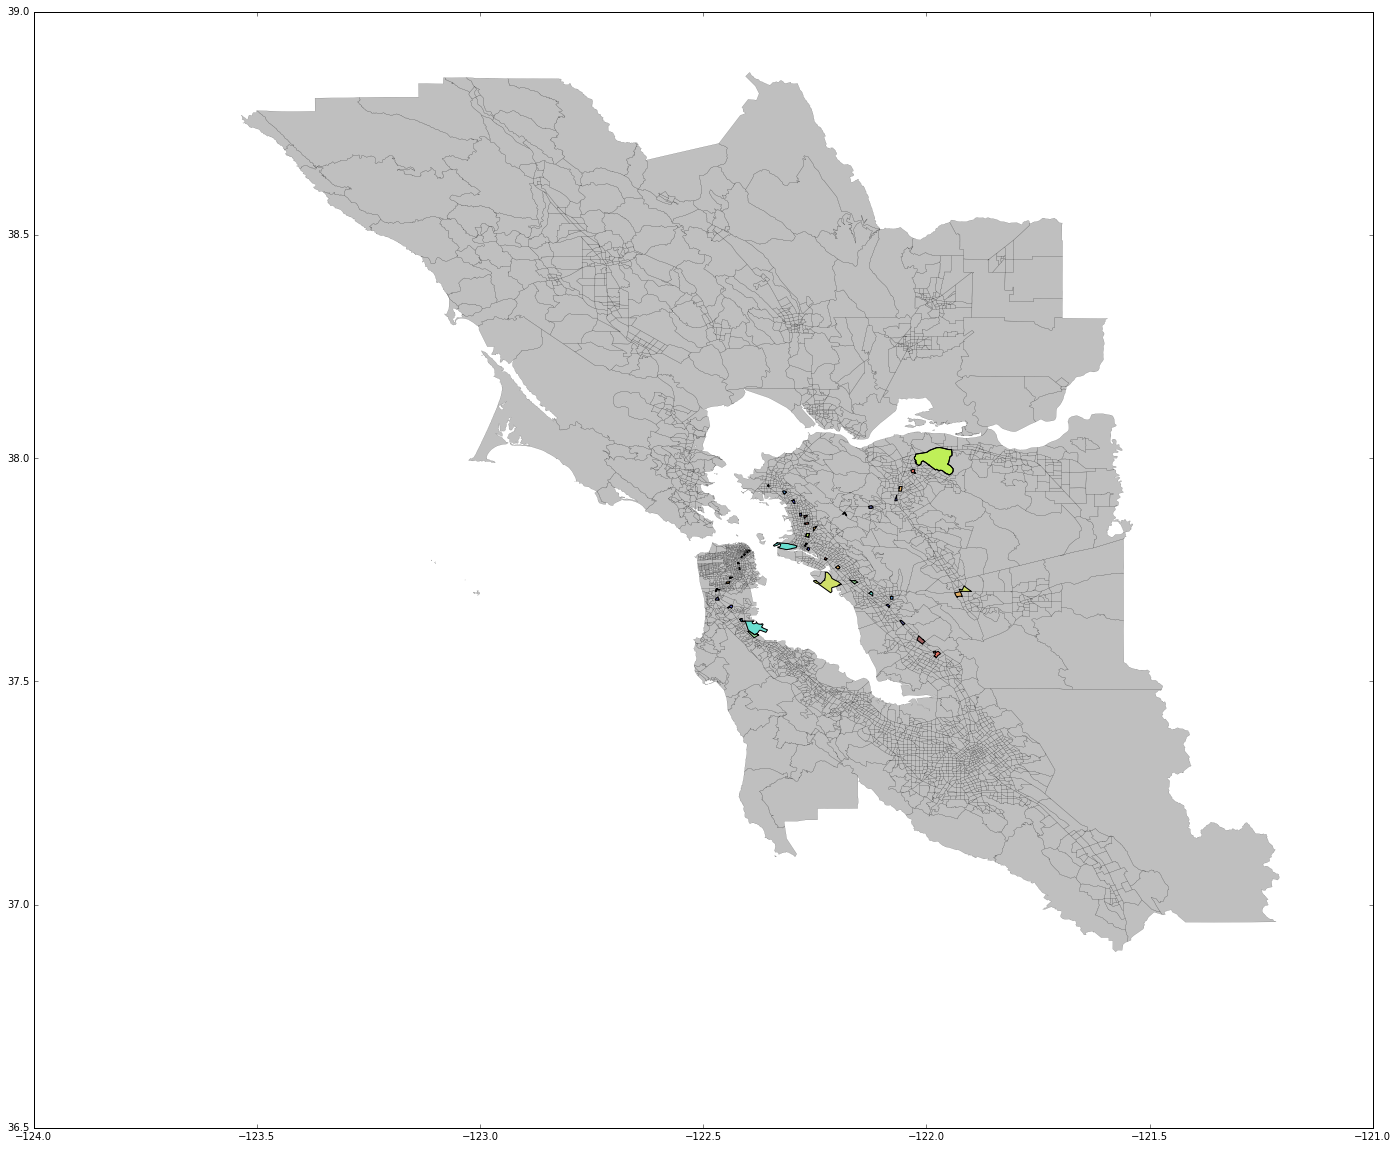
The following two maps are highlighting the Bay Area specifically. The first is creating a buffer around BART stations and identifies the 2000 Census Transportation Analysis Zone (TAZ) associated with each BART station.
Future Work:
Future analysis will include additional transportation data for the state as well as a broader database of California subsidized housing units, as provided by the California Housing Partnership Coalition (CHPC). Using the buffer zones and TAZ information will allow for analysis about housing that is reachable within a certain distance of transit. This information will then be compiled and analyzed with additional amenity, employment and street data information to better understand accessibility at these sites.
The projection used is: {‘init’ :’epsg:4326′}