
PART I: The Affordable Housing and Sustainable Communities Program (AHSC)
In 2014, the Strategic Growth Council (SGC), California Department of Housing and Community Development (HCD), and the California Air Resources Board (ARB) established the Affordable Housing and Sustainable Communities Program (AHSC). The AHSC program funds affordable housing near public transportation with revenues from the State’s cap-and-trade program (Strategic Growth Council, 2015) and serves to further progress towards mandated greenhouse gas emission (GHG) reductions (AB32, 2006) and coordinated land use and transportation development (SB375, 2008).
Half of the funds for the program go towards Disadvantaged Communities (as defined by the California Environmental Protection Agency), while at least half are dedicated to affordable housing preservation and development for lower income households. The program funds three types of affordable housing projects: Transit Oriented Development (TOD) (targeted to receive at least 35% of available funds), Integrated Connectivity Project Areas (targeted to receive 35% of funds) and Rural Innovation Projects (targeted to receive 10% of funds). To be eligible for the TOD program, properties must be located within a half-mile of a Qualifying Transit Station served by High Quality Transit, defined as: “A Qualifying Transit line with high frequencies AND permanent infrastructure”. The definition of Qualifying Transit specifies requirements for public operations involvement, includes rail and bus service, and requires service that departs at least two times during peak hours (see below for complete definition). High frequency includes services with peak period headways of fifteen minutes or fewer and routes with daily service. Permanent infrastructure status requires the transit route operate on a railway or Bus Rapid Transit service with some variation of a dedicated or high occupancy lane (Strategic Growth Council, 2015).
Projects submitted for AHSC funding are scored on a 100-point scoring system. Of the 100 points, projects can receive up to 15 points for “Total Project GHG Reductions”, which is calculated based on the projected vehicle miles traveled (VMT) reduction of the project. This reduction is estimated through a rubric that includes certain indicators such as: density, land use diversity, the accessibility of destinations (measured by distance to the Central Business District) and the provision of affordable housing (Strategic Growth Council, 2016). Including affordable housing in a project has an estimated VMT reduction maximum of 4%; density, diversity, and accessibility to destinations range between 20% and 30%.
A number of factors influence VMT patterns. In academic and transportation research, the commonly referred to categories are the Three Ds: Density, Diversity, and Design (Cervero & Kockleman). Often these three Ds are met through transit-oriented development (TOD), and a number of studies have sought to understand the relationship between TODs and VMT. Lund, Cervero & Wilson concluded that residents living in TODs were five times as likely to use transit for their commute compared to the average resident in a study of sites located in non-Central-Business-District areas throughout California (Lund, Cervero, & Wilson, 2004). Income, accessibility, parking availability and network capacity / congestion are other factors that have been researched (Chatman 2013, 2006, L. Zhang, Hong, Nasri & Shen, 2012).
Recent studies have suggested that building affordable housing near transit could result in significant reductions in VMT but the research is highly limited and sample sizes are frequently too small for statistical significance (note studies by: Newmark & Haas, 2015; Kroll & De La Cruz, 2014; Stiffler, 2011; Mallet, 2012). While further research is needed with regards to VMT and affordable housing near transit, it is also important to consider the co-benefits of locating housing near transit. Low-income populations have lower rates of car ownership: an analysis of the 2001 National Household Travel Survey (NHTS) found that over 25% of households with incomes below $20,000 had no motor vehicle compared to only 1.2% of households with incomes over $75,000 (J. Pucher & Renne, 2003). Developing affordable housing near transit could increase employment, education, and service accessibility.
The following analysis aims to provide information about California’s subsidized housing and to help the Air Resources Board identify sites that could be eligible for AHSC funding and/or for studies regarding VMT reduction and amenity and employment accessibility. Furthermore, the deliverables serve as tools for people who may be interested in finding affordable housing opportunities near transit.
PART II: State Subsidized Housing Information & Public Transit Data
II.A Transit Data
The Strategic Growth Council has compiled a dataset of what routes qualify as High Quality Transit (HQT). This dataset was used to create a database of all of the stops that are along HQT routes. General Transportation Feed Specialization (GTFS) data was collected from the following agencies:
- Santa Clara Valley Transportation Authority (VTA)
- San Francisco Municipal Transportation Agency (SFMTA)
- Bay Area Rapid Transit (BART)
- Sacramento Regional Transit (RT)
- San Diego Metropolitan Transit System (MTS)
- LA County Metropolitan Transportation Authority (LA Metro)
- Foothill Transit
The GTFS data was collected in Fall 2016 and represented the most up-to-date information as provided by the agencies. All stops along routes identified as HQT are maintained in the transit dataset.
II.B Housing Data
Subsidized housing information was collected in partnership with the California Housing Policy Corporation (CHPC) and is comprised of the following programs:
- HUD
- LIHTC (referred to as TCAC: California’s Tax Credit Allocation Committee)
- Multi-Family Housing Direct Loans (referred to as: mfhd) through the United States Department of Agriculture
The data was cleaned to be updated through 2016. Public housing is not included. A number of properties participate in more than one of the above programs. In cleaning three data sets, a single database was compiled that maintains all available information for each individual property. Each program provides a different level of detail regarding the property and, as a result, some analysis can only be conducted for properties within the same program.
PART III: Analysis & Web Tools
III.A Subsidized Housing Database
A total of 5,747 properties were included in the final database, with 462,169 total units; 400,999 of these were classified as assisted units. Nearly 300 properties had zero rental-assisted units listed but they remain in the database and are mostly associated with mfhd and HUD. Table 1 highlights some of the key statistics of each program.
Table 1.
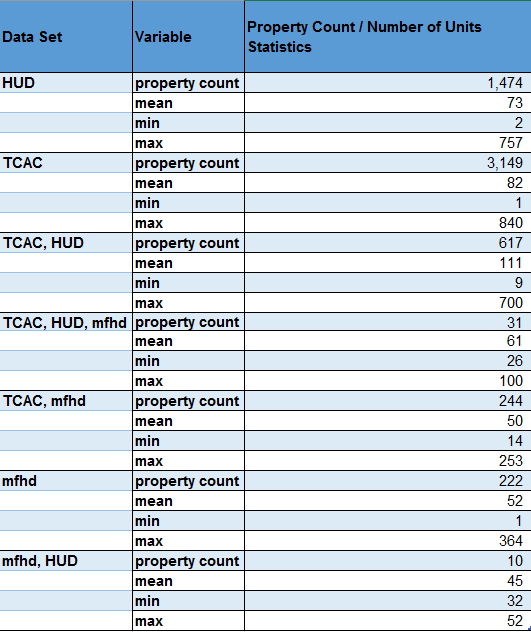
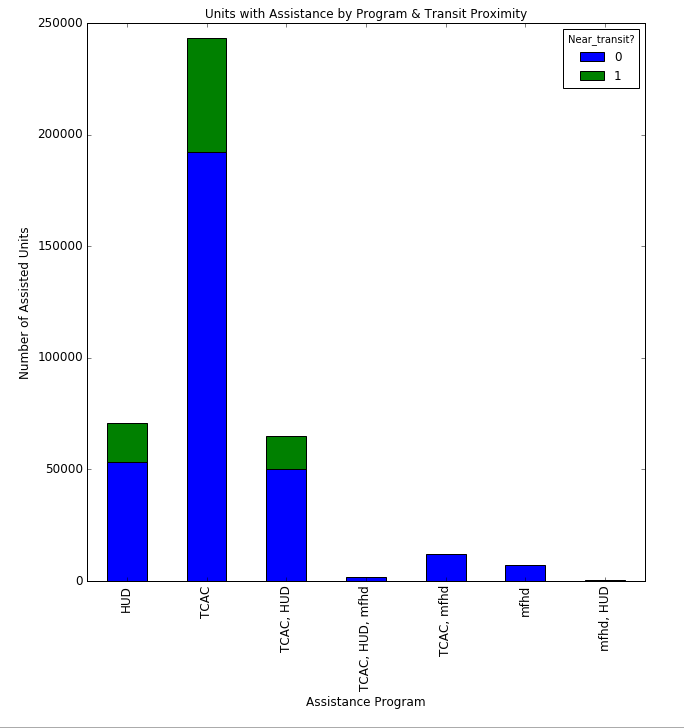
The TCAC program had the most number of properties and units in the database. The following charts outline the number of properties (Chart 1) and the number of assisted units (Chart 2) by dataset. Chart 2 also highlights the number of assisted units within a half-mile of transit.
Chart 1.
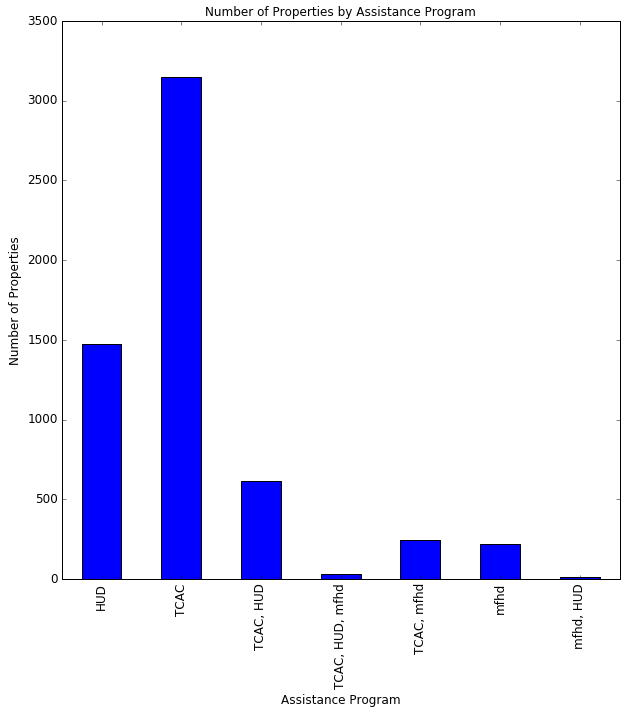
Chart 2.
Based in part on the New York University (NYU) Furman Center Subsidized Housing Information Project (SHIP) Core Data Tool (available here), the following map (Map 1) offers information about housing properties such as total number of units, number of assisted units, type of household units (e.g. senior housing), and program. Properties colored in dark blue are within a half-mile of High Quality Transit routes; transit stops (in green) are identified by agency. Users can click on each property to find out more information.
Map 1.
III.B TCAC Program
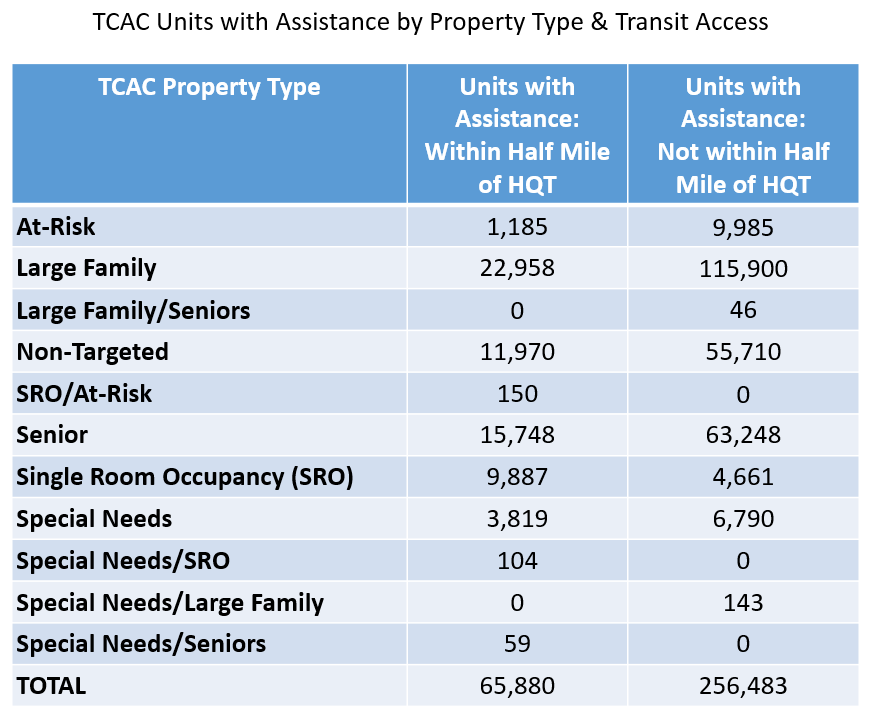
The TCAC program has a high level of detailed information for the properties and permits further analysis. Table 2 highlights the units with assistance both within a half-mile of HQT and not within a half-mile of HQT by property type. Property type can have a significant impact on household needs and VMT outcomes and can also help the state identify properties that would benefit from additional assistance; for example, at-risk identifies properties that are at-risk of converting to market rate development. Senior populations may benefit from increased access to health services, while large families might prefer housing near schools. Single Room Occupancy (SRO) developments are more common for properties closer to transit. This could be due to the increased cost of housing and decreased space availability in denser urban centers such as San Francisco that offer High Quality Transit.
Table 2.
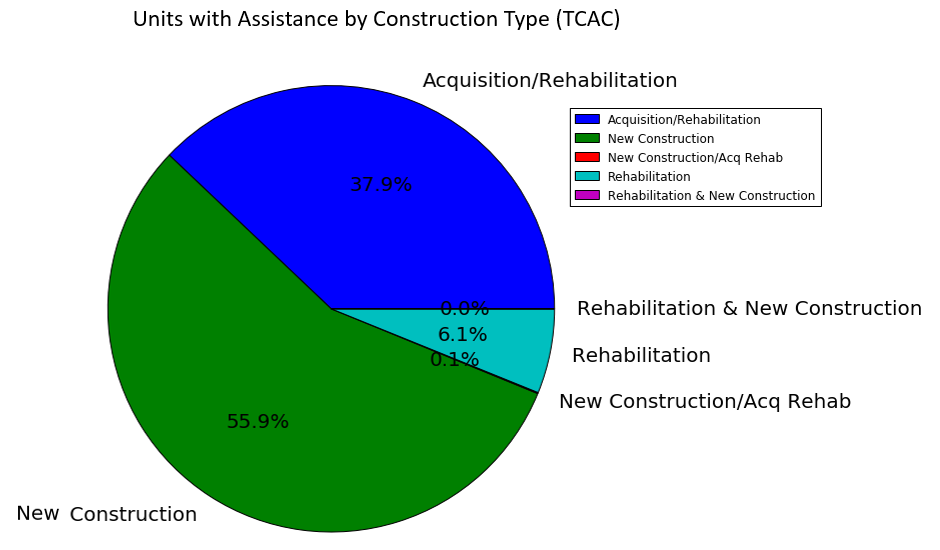
The TCAC properties also identify the construction type and include: New Construction, Acquisition, and Rehabilitation, and the various combinations that projects might have. The majority of the units with assistance for the TCAC program fall under New Construction (Chart 3).
Chart 3.
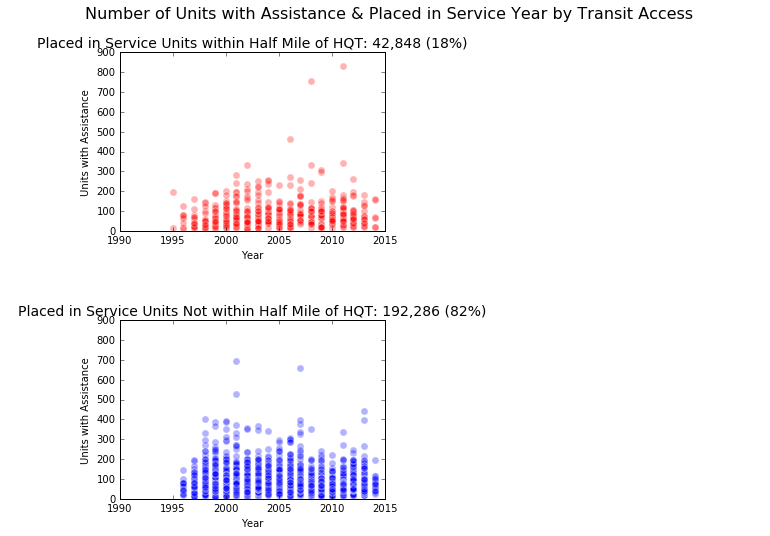
Lastly, TCAC identifies the application stage associated with a permit. The options are: Preliminary Reservation, Placed in Service and Extended. Chart 4 identifies the number of units with assistance placed in service between 1995 and 2016 within a half-mile of HQT and not within a half-mile of HQT. Eighteen percent of the units that were placed in service during these two decades were within a half-mile. This chart looks at the sizes of the properties that were added as well and it is interesting to note that the largest property in the database (840 units) is within a half-mile of HQT. It is also helpful to look at TCAC properties placed in service spatially and over time, as is done in Map 2. This map shows how the location of affordable properties placed in service since 1995 has expanded from city centers to areas more dispersed throughout the state.
Chart 4.
Map 2.
III.C Census Analysis
While the property information is limited by what the programs provide, it is possible to conduct further analysis by associating the housing properties to census tracts. Census tracts were listed as “within a half-mile of transit” if any of the properties within the tract were within a half-mile of an HQT stop. Map 3 identifies the percent of people that drive alone according to the 2015 five-year ACS Census. It is possible to highlight the layers that have tracts near transit and those that do not have any subsidized housing properties within a half-mile.
Map 3.
PART IV: Future Analysis
This database will provide both the State and people searching for a home with important information. It would be ideal for the interactive web-based map showing properties and HQT to be updated each year as permits expire and are added and as new transportation options qualify as High Quality. CHPC maintains a PolicyMap website that includes information about subsidized housing for the state and adding the layer of HQT could support future AHSC program development.
Future analysis should incorporate additional measures of accessibility and conduct this study with network analysis rather than as-the-crow-flies half-mile buffers. In particular, next steps should include: assessment with street network, grocery store and recreational access, distance from education and health services, and employment accessibility. It would also be beneficial to overlay additional California Household Travel Survey (CHTS), Census and National Household Travel Survey (NHTS) information. Further statistical analysis with Census overlays may also provide interesting findings to understand if/how people’s travel patterns vary by distance to transit once accounting for other VMT factors (income, age) and density.
The findings from this study will help to provide information for further research conducted by the University of California, Berkeley and the Air Resources Board. In particular, sites with High Quality Transit access will be chosen for resident surveying and travel log data collection. Focus groups will also be conducted to better understand the co-benefits (and also potential drawbacks/challenges) of transit-oriented affordable housing development. In addition to collecting amenity and employment accessibility metrics as discussed, it will also be important during the site selection process to collect information about the property and its land use and transportation connection. For example, researchers should identify how much parking is available on site, if subsidized transit passes are available to residents, if there is a diversity of land uses nearby, pedestrian walkability and the site’s highway accessibility. Recent research has found that network capacity and parking could be some of the most significant indicators of VMT (Chatman 2013).
The above analysis provides a foundational database for future surveying, site selection and property analysis. The goal is to increase understanding of commute patterns at subsidized properties near transit, to support state efforts in identifying what types of projects and properties might benefit from future investment, and to explore how this housing can best serve residents.
APPENDIX
Relevant AHSC Definitions
[1] “Qualifying Transit” is defined as: “A transit line serving the public that is operated by the following: (1) Directly operated by a public entity; (2) Operated by a public entity via a contract for purchased transportation service with a private or non-profit provider; or (3) Operated by a private or non-profit entity as a grant Recipient or sub-recipient from a public entity. Qualifying Transit for the purpose of the Program includes various forms of fixed transit service (Rail Service and Bus Service) and Flexible Transit Service. A Qualifying Transit line requires service that departs two (2) or more times during Peak Hours as defined by the transit operator. Flexible Transit service is exempt from these Peak Hours frequency requirements.”
“Flexible Transit Service” is defined as: “A form of transit for the public characterized by flexible routing and scheduling of small/medium vehicles operating in share-ride mode (with at least two passengers) between pick-up and drop-off locations according to passenger needs. Flexible Transit Service includes vanpool, shuttle and feeder bus systems that reduce vehicle miles travelled.” (Strategic Growth Council, 2015)
REFERENCES