It is no secret that San Francisco is in a housing crisis. With median house prices above a million dollars and growing with no sign of stopping, San Francisco has become the least affordable city in the United States. A common response is simply to increase the supply of housing.
But, what are the necessary aspects of building more housing in San Francisco? There are many factors that contribute to the housing crisis. Zoning plays a big part in what gets built where, but there are other aspects of city building that must be in place to ensure that development can occur. The presence of competitive construction companies to assist with the cost of labor, inexpensive materials, and a speedy permitting process all play a role in building. The following analysis looks at the construction industry (and other supportive industries), and where permits have been issued, completed, and the number of units
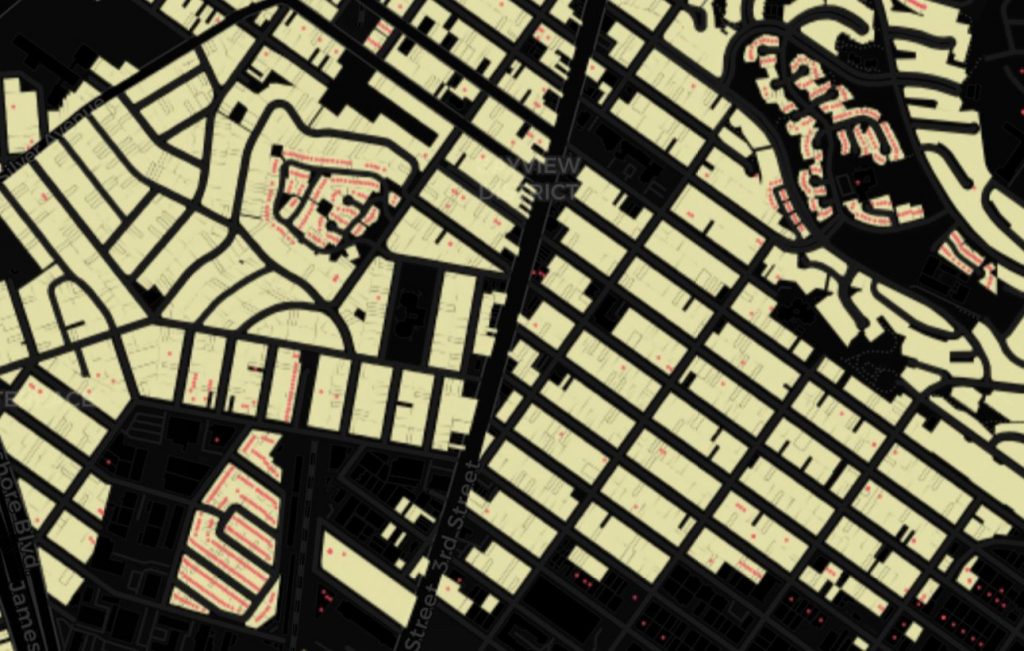
ZONING IN SAN FRANCISCO
As we can see from the above, a large amount of the city is zoned for either residential or mixed residential (as evidenced by the large swaths of yellow). For the purposes of this post, I have combined residential and mixed residential. Mixed residential can have mixed uses and residential, but in a housing market as dire as San Francisco, the land use tends to be residential as those uses tend to be more lucrative for developers. This zoning code influences the decisions of those requesting permits and construction companies locations alike and provides a necessary back drop to understanding development.
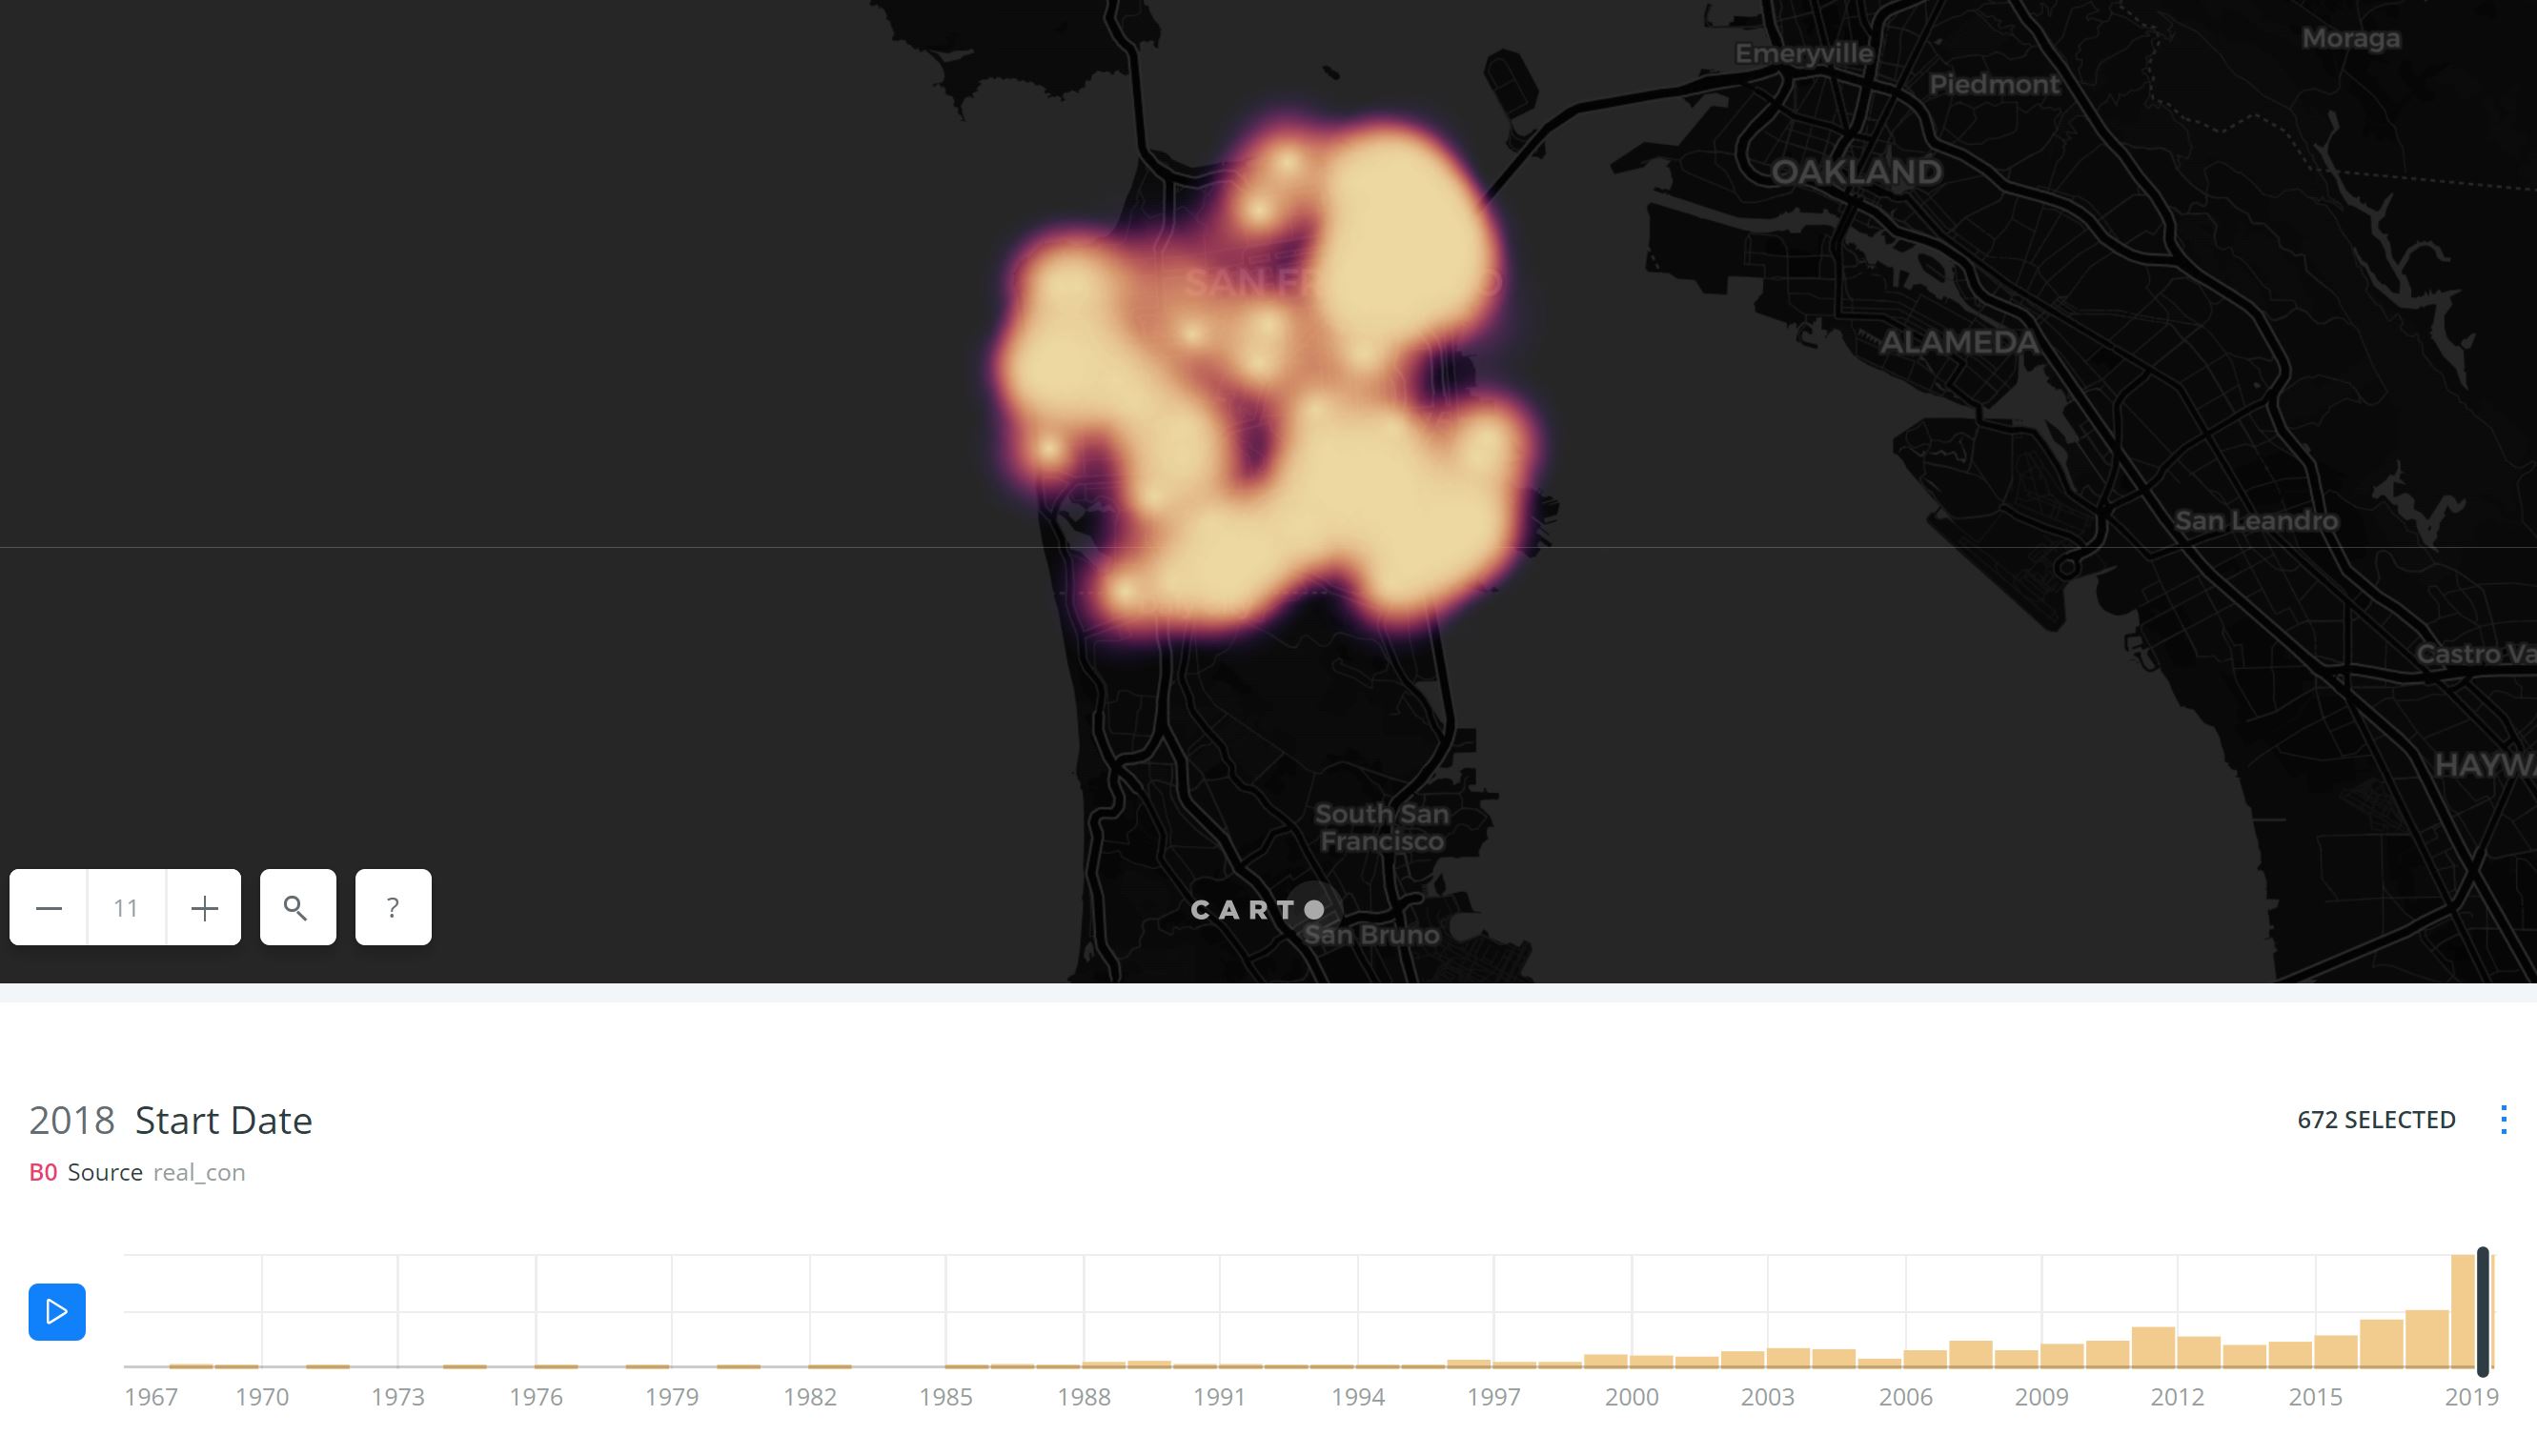
CONSTRUCTION COMPANIES ADDED IN SAN FRANCISCO (1969-2018)
The above map provides a 30+ year heat map of construction companies in San Francisco. While this map provides a look at company start dates and not end dates (some of the companies have closed), it does illustrate times of considerable growth in the construction industry. This calculates establishments, so firms could be counted multiple times depending on the amount of locations.
2018 has seen by far the biggest growth in the past 30 years of this sector.
Because the cost of an office in San Francisco, I would imagine this only makes sense if the majority of a company’s clients are also in San Francisco. In order to relocate, one would imagine that permitted buildings that are already in the process of securing bids from construction companies are in the pipeline.
COMPLETED PERMITTED BUILDINGS (1982-2018)
The completed building permit map illustrates a bit of the reason why we are in this situation. The majority of buildings built between 1982 and 2018 were built in the 80’s and early 2000’s. The dot size represents the number of units in each permitted building. While the majority of the city is covered in some form of red, the vast majority of those dots represent just 1 unit.
This implies that the building that precipitated the increase in construction companies has yet to occur. Construction companies wouldn’t locate here if it weren’t on the precipice of happening though. But what is the nature of this development that is coming our way and where will it be?
PERMITTED BUILDINGS YET TO BE BUILT
The development that is slated for San Francisco, judging by the 425 issued permits will be dense apartment complexes predominantly in the South of Market neighborhood, South Beach, and the Mission. While there are still single family homes being built elsewhere, I would venture to say that the large increase in construction companies has resulted in the approval of these large permitted buildings.
This huge shift in the nature of development has large implications for San Francisco’s planning department and public works. The total number of units 17,717. Using the average household size of 2.58, this would result in approximately an additional 46,000 people in San Francisco (or 5% of the current population). However, the distribution of these people will be largely concentrated in the areas South of Market.
This will pull the center of gravity of San Francisco south of it’s current Market Street border and will require significant investment in the public realm, transit, and services in this area to accommodate this influx.
Just for fun…
REAL ESTATE COMPANIES ADDED IN SAN FRANCISCO (1969-2018)
Someone needs to sell those apartments, and Real Estate companies have already begun to increase. I can only imagine this number will increase one the 425 projects have been completed. This may be an excellent time to get into real estate (if it isn’t too late).