Crowdsourcing:
Using Geotagged Photos to Analyze the Relationship between Cultural Ecosystem Services and Site Specific Features of Urban Green Space in San Francisco
Urban green space (UGS) is one of few places people in cities can get in touch with nature and has provided multiple benefits for the public. Cultural ecosystem services (CES), known as non-material benefits human obtain from ecosystems including aesthetic, recreational value, and sense of identity, is the dominant category of benefits provided by UGS. However, lack of spatial explicit data, the mapping and assessment of city-wide CES is underdeveloped. Crowdsourced data from mobile devices, especially geotagged photos collected from photo-sharing platforms, cost-effective without spatial and temporal limitation, tend to be attractive source of information to evaluate CES. Geotagged photos in UGS can help understand people’s interaction with landscape and the site-specific features related to CES provision. This study used geotagged photos from Instagram and Flickr to investigate the spatial and temporal pattern of CES provided by UGS in San Francisco during 2017 Summer. The final aim was to analyze the relationship between CES provision and site-specific features of UGS.
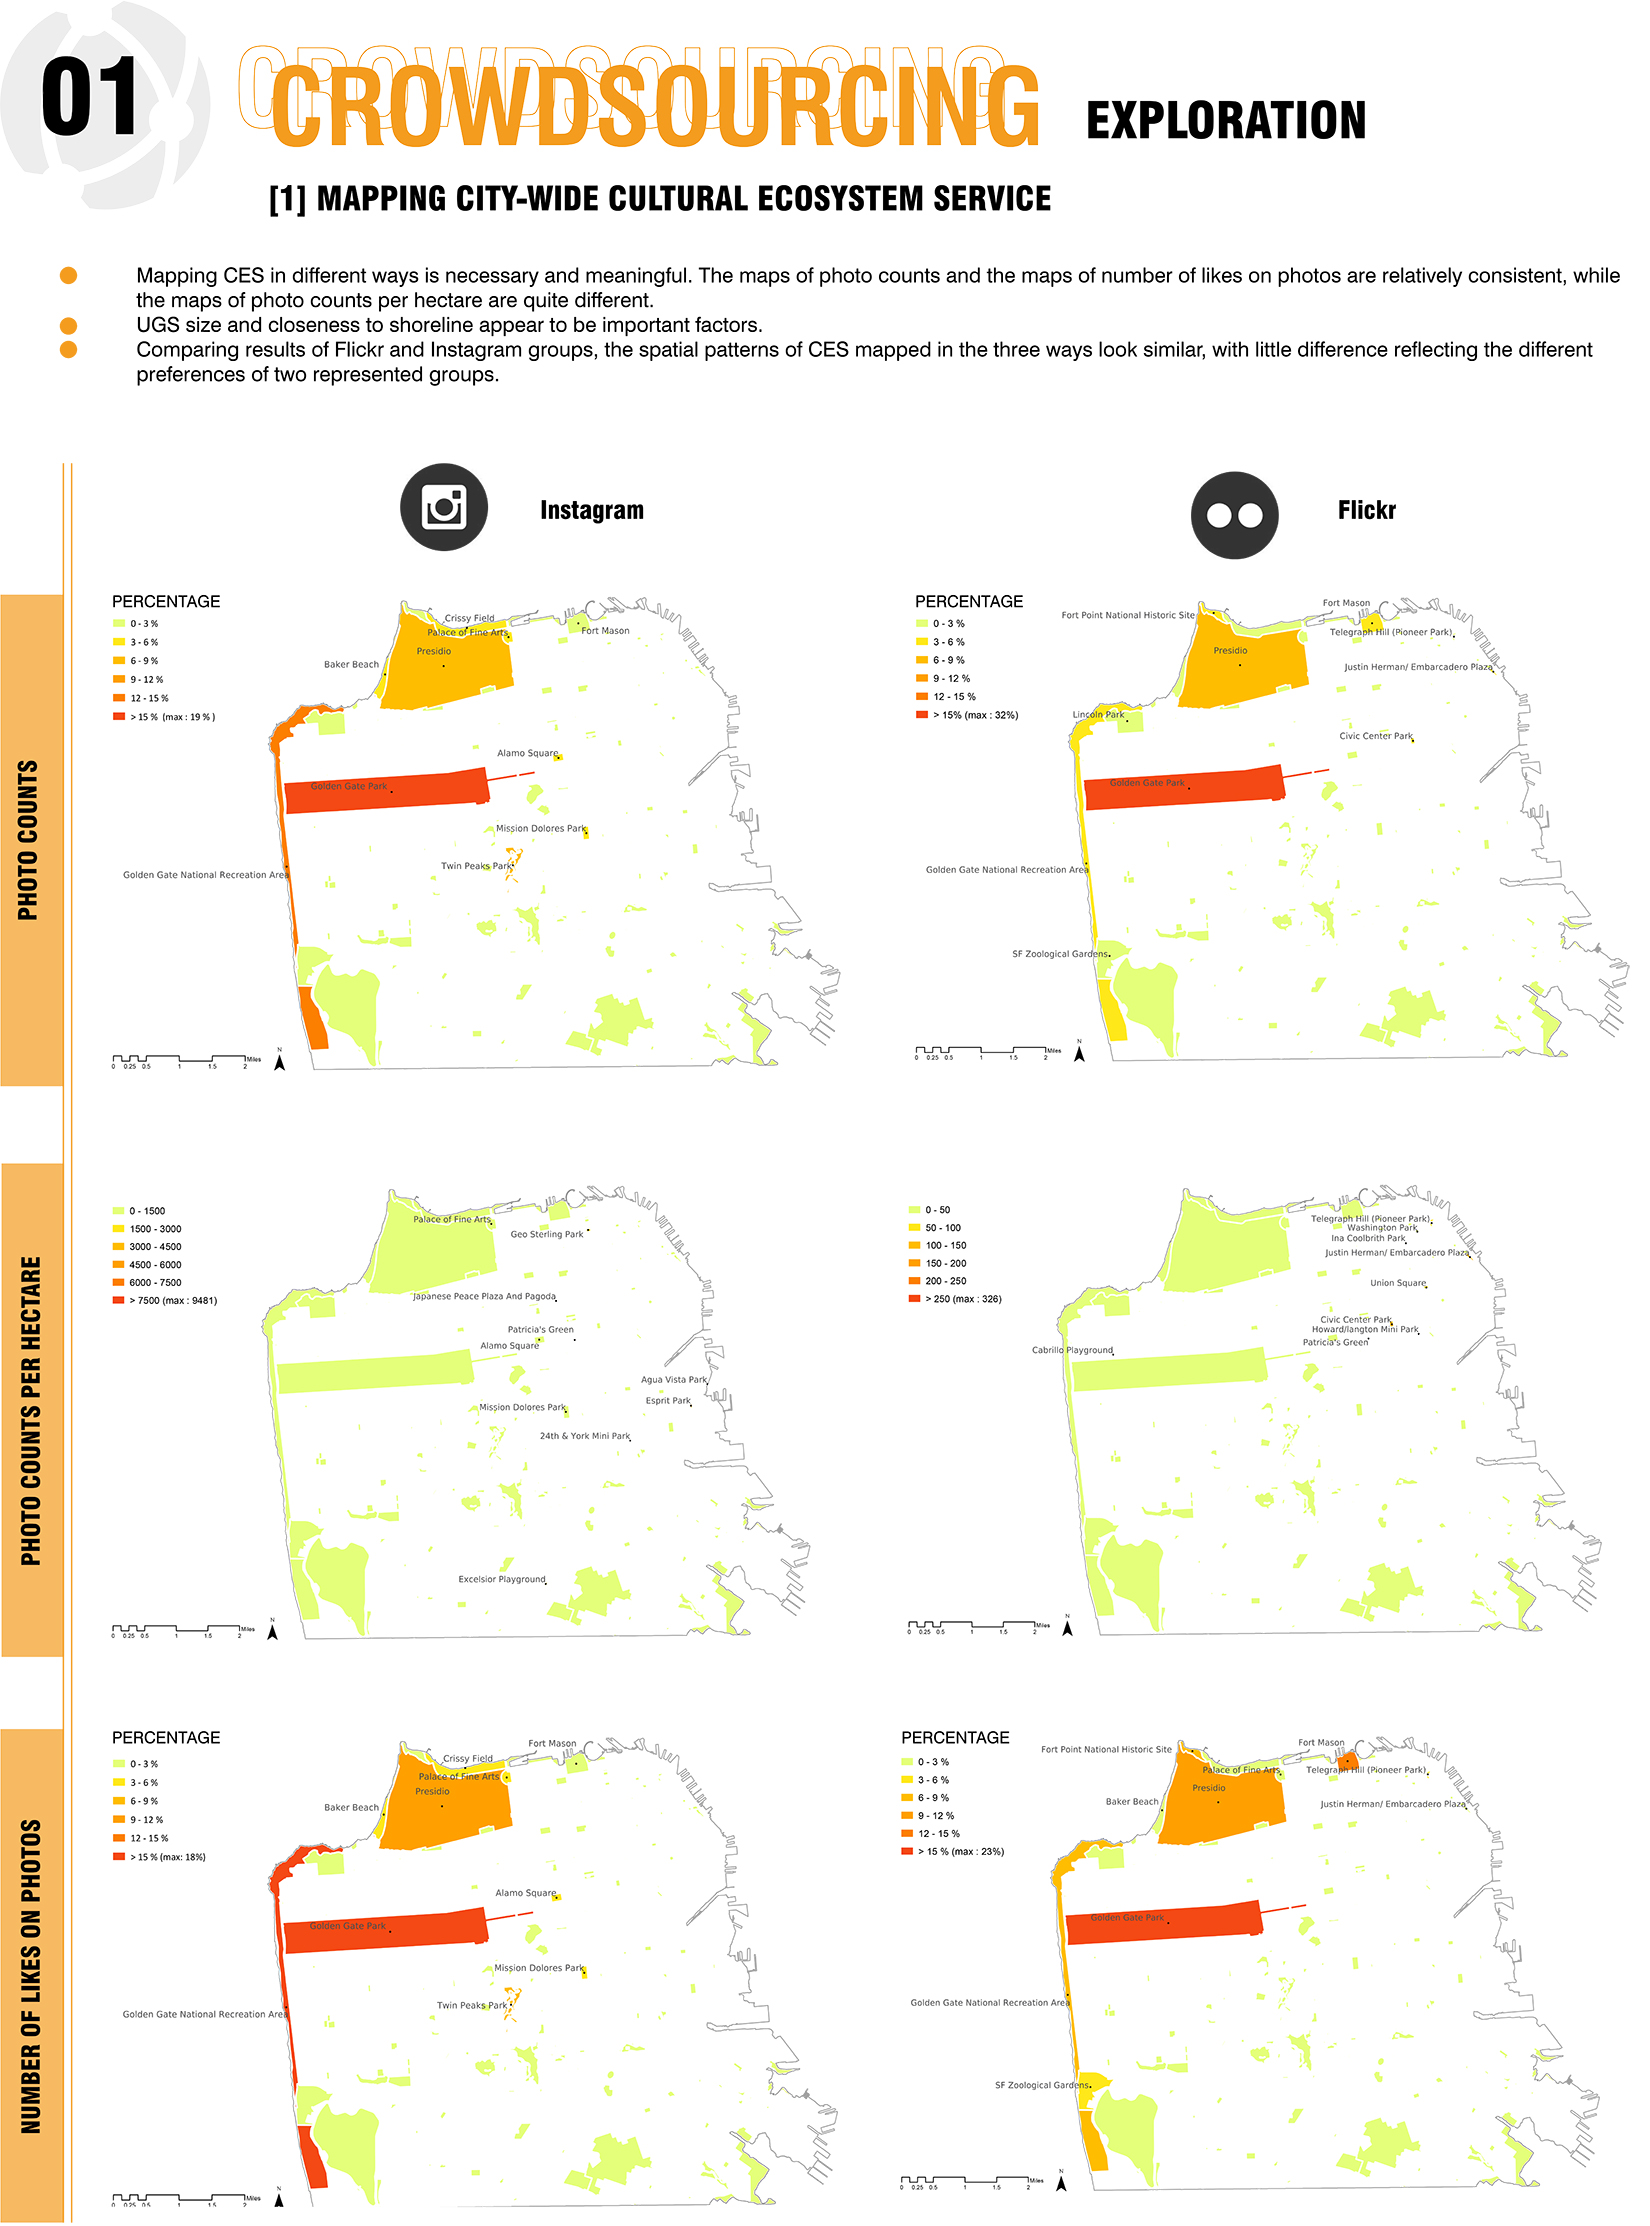
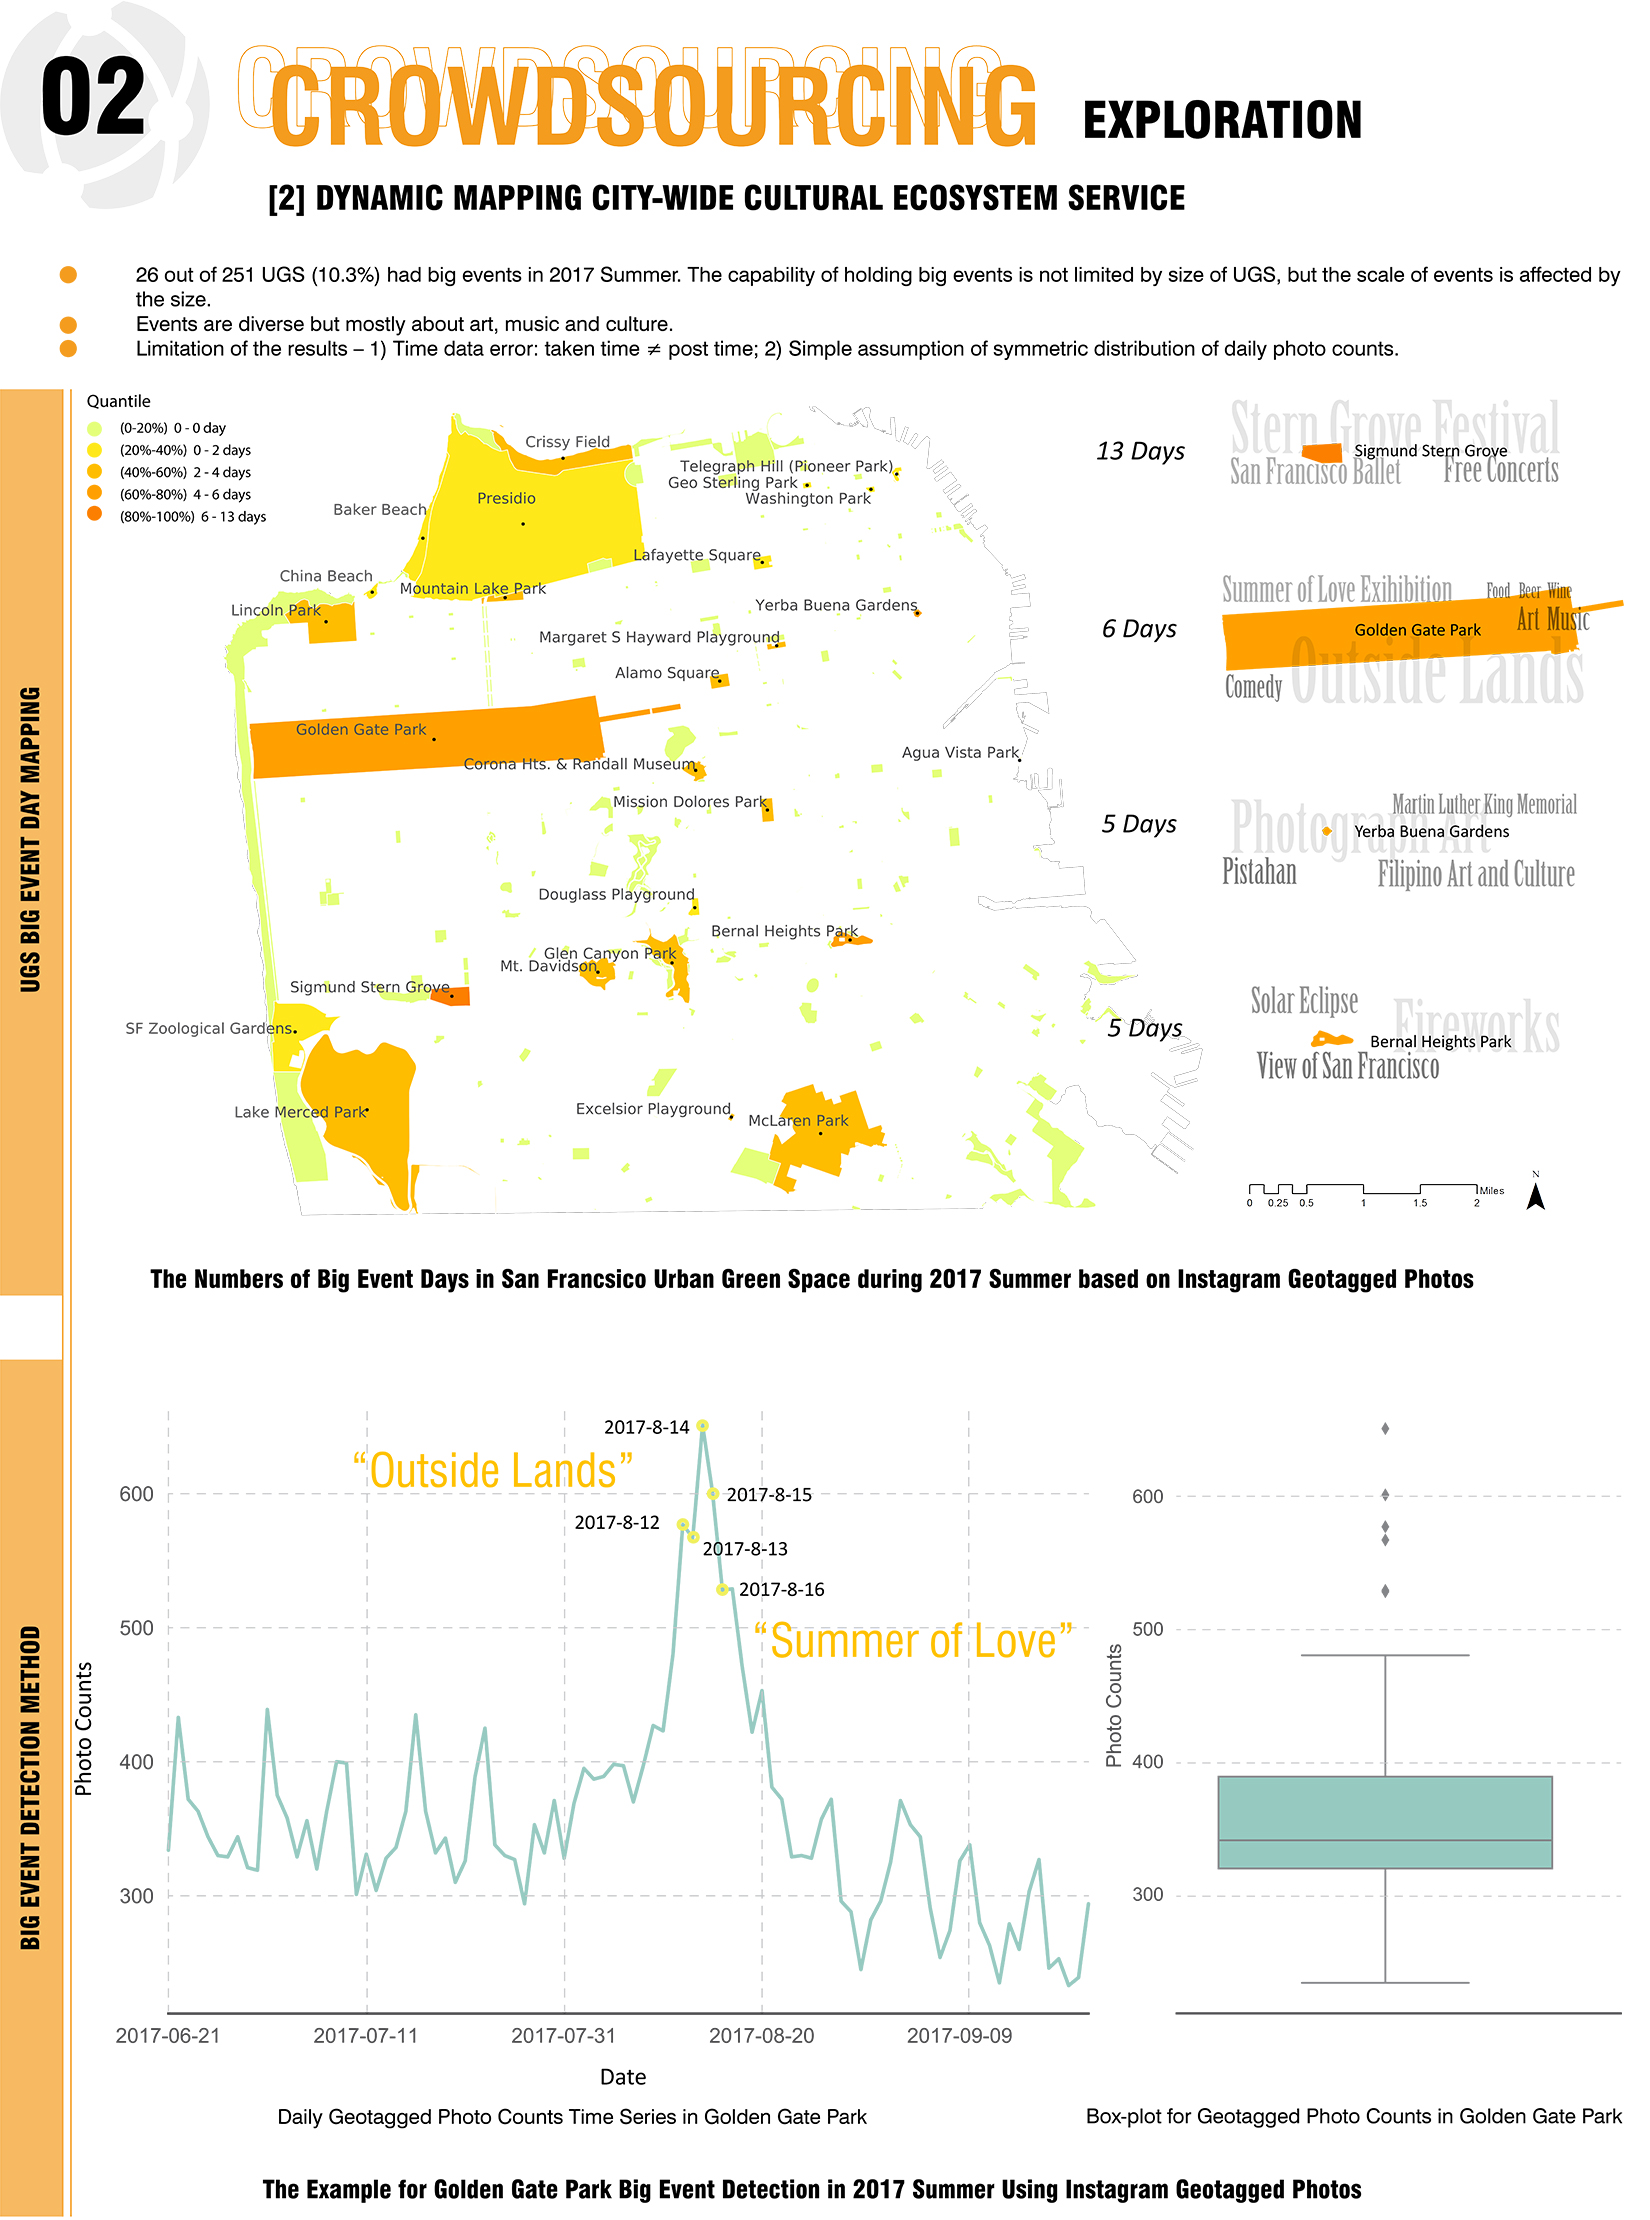
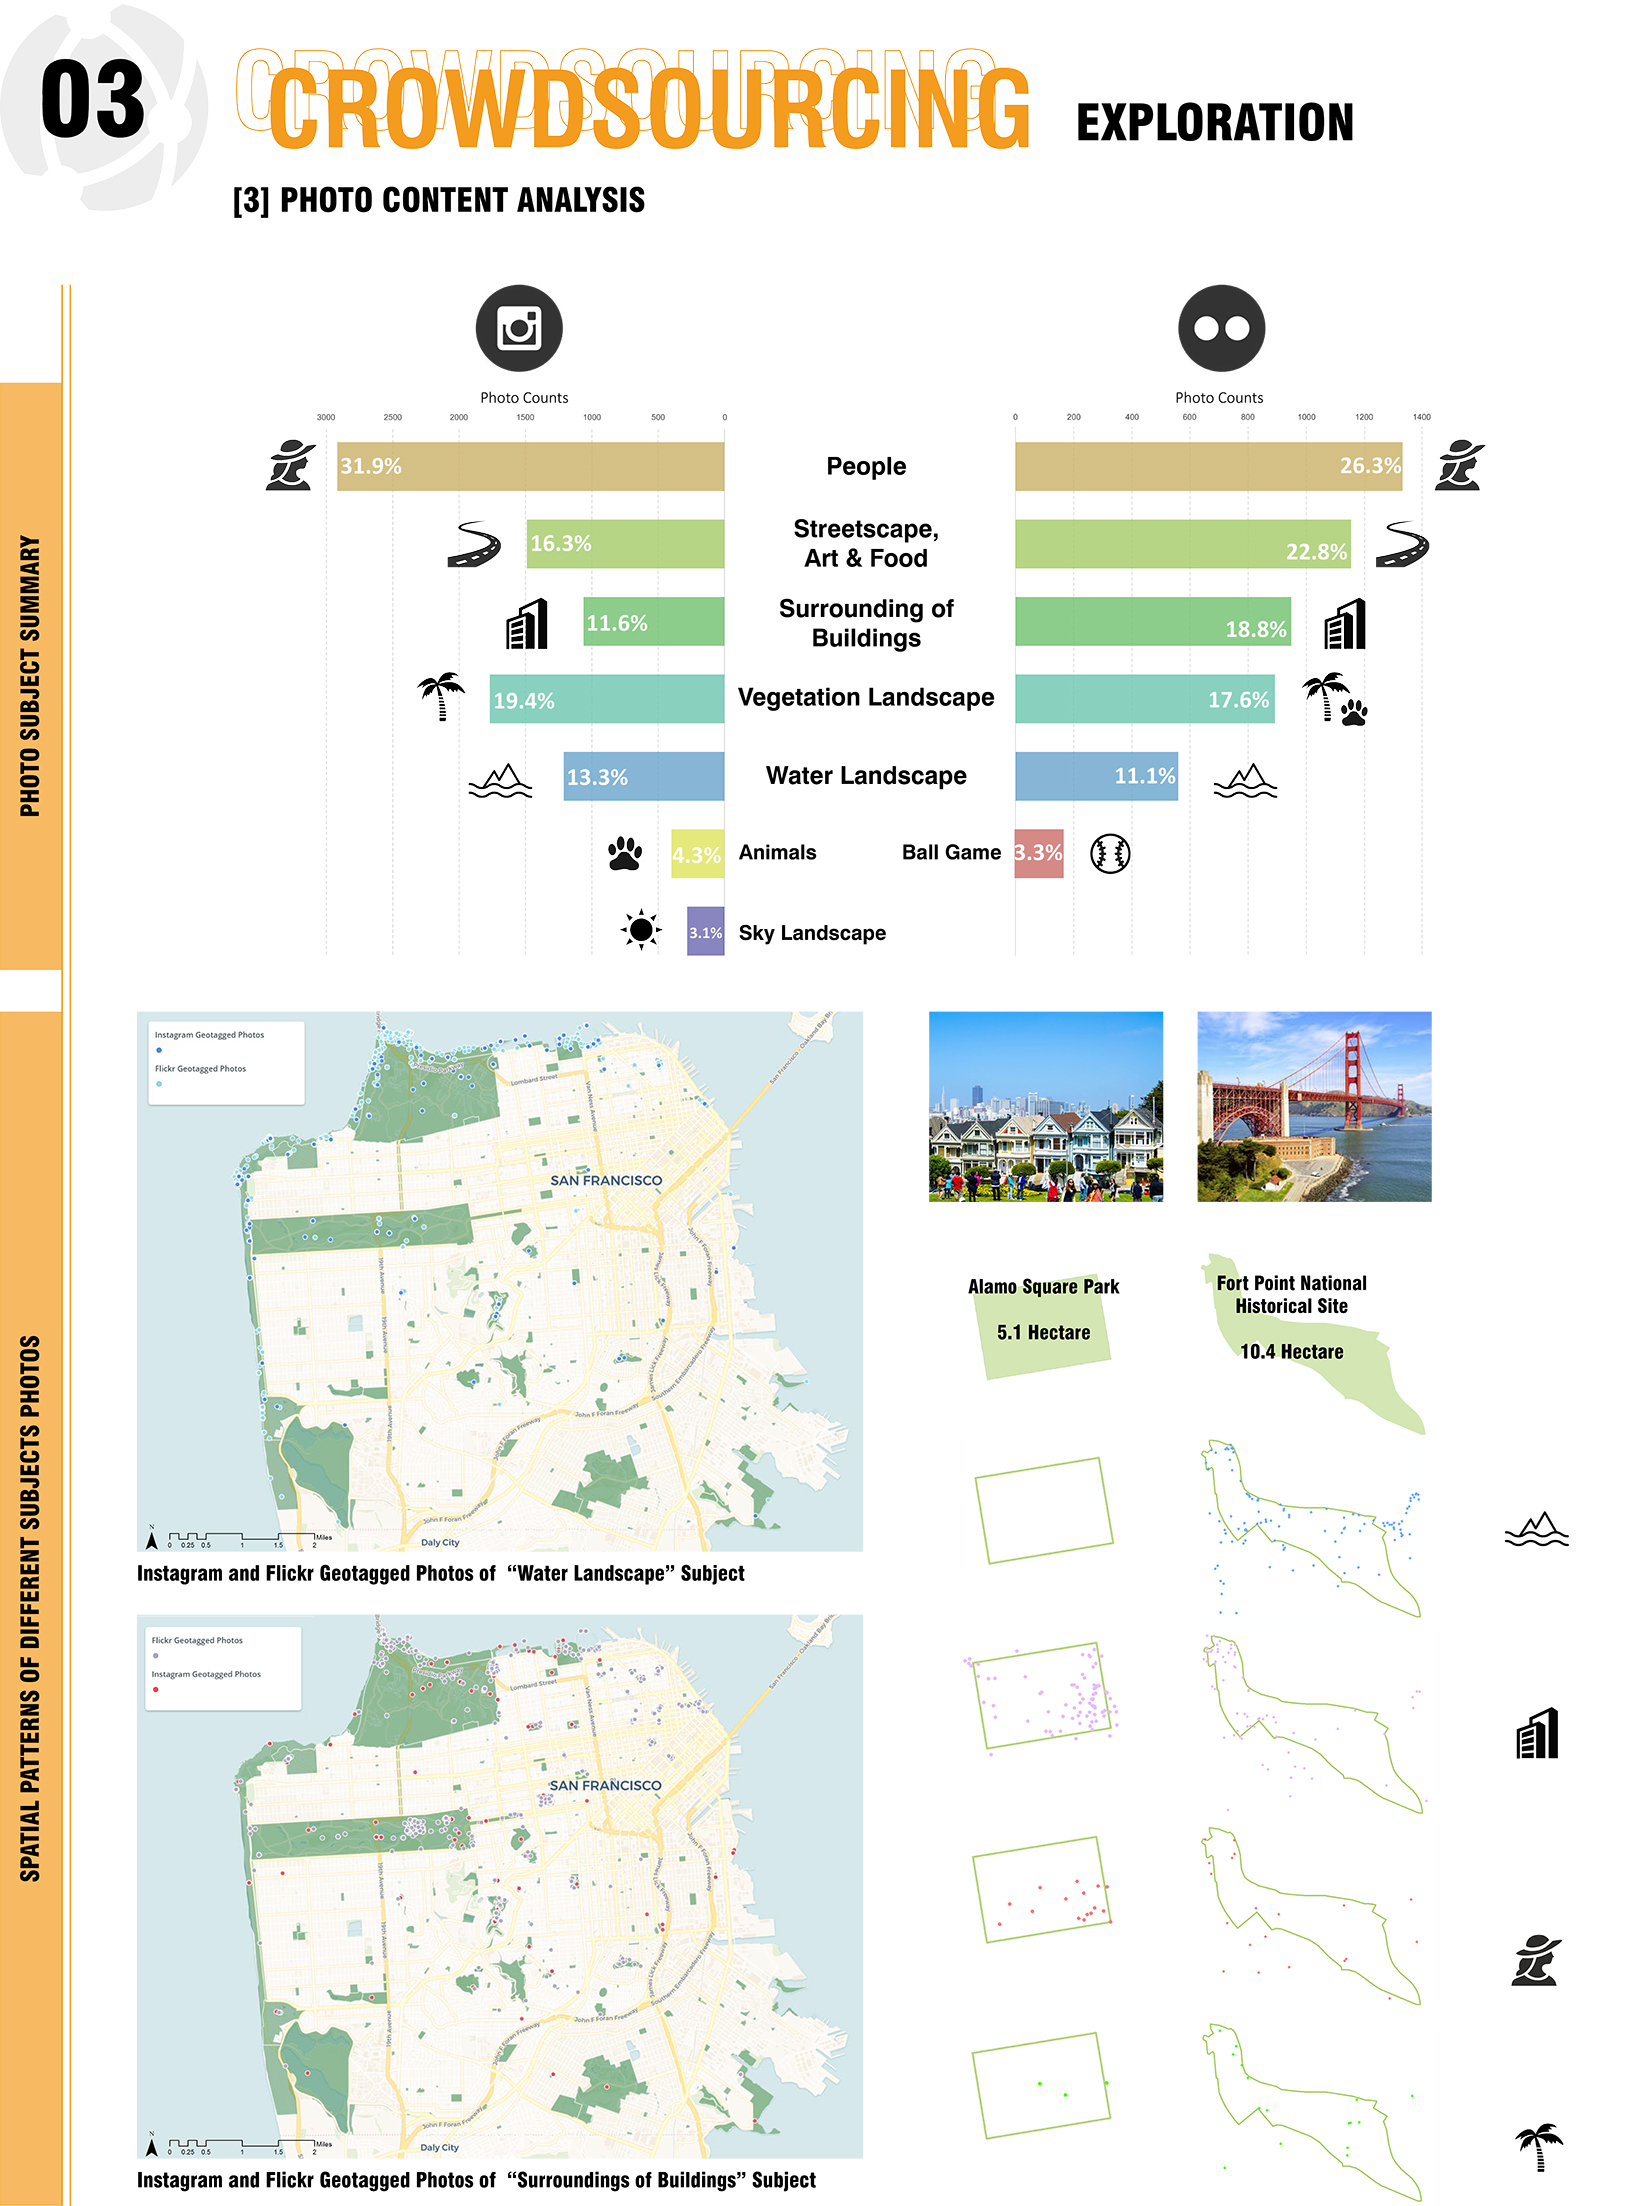
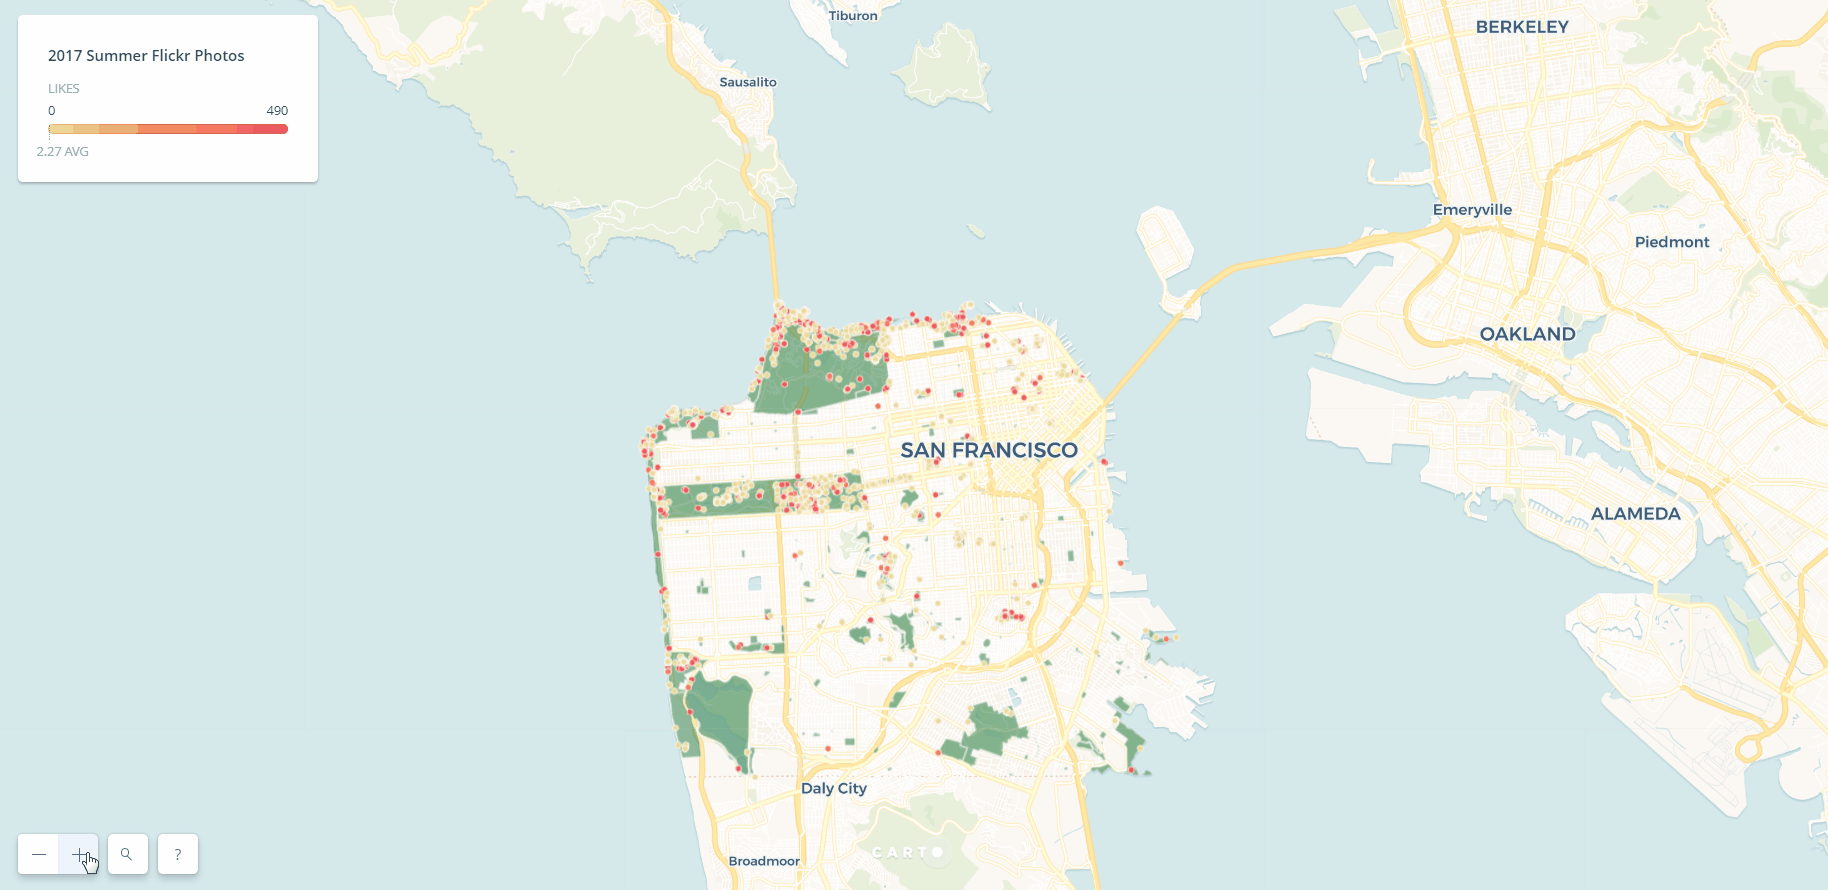
Methods: To achieve this goal, firstly, I mapped CES in three ways for Flickr and Instagram two groups and compared the results across different approaches and groups. Then I examined the UGS daily photo counts time series to detect anomalies, and used the tags of photos to understand the meaning of anomalies in terms of CES. After that I performed an automated content analysis of 5,034 and 10,000 photos from Flickr and Instagram using an online image recognition API – Clarifai, and applied Hierarchical Clustering Algorithm (HCA) to figure out visitors’ main interest in UGS. Based on the results of these analyses and literature review, I made hypotheses about the relationship between CES provision and five categories of site-specific features of UGS, and tested them using multivariate ordinary least squares (OLS) linear regression models and zero-inflated negative binomial regression models.
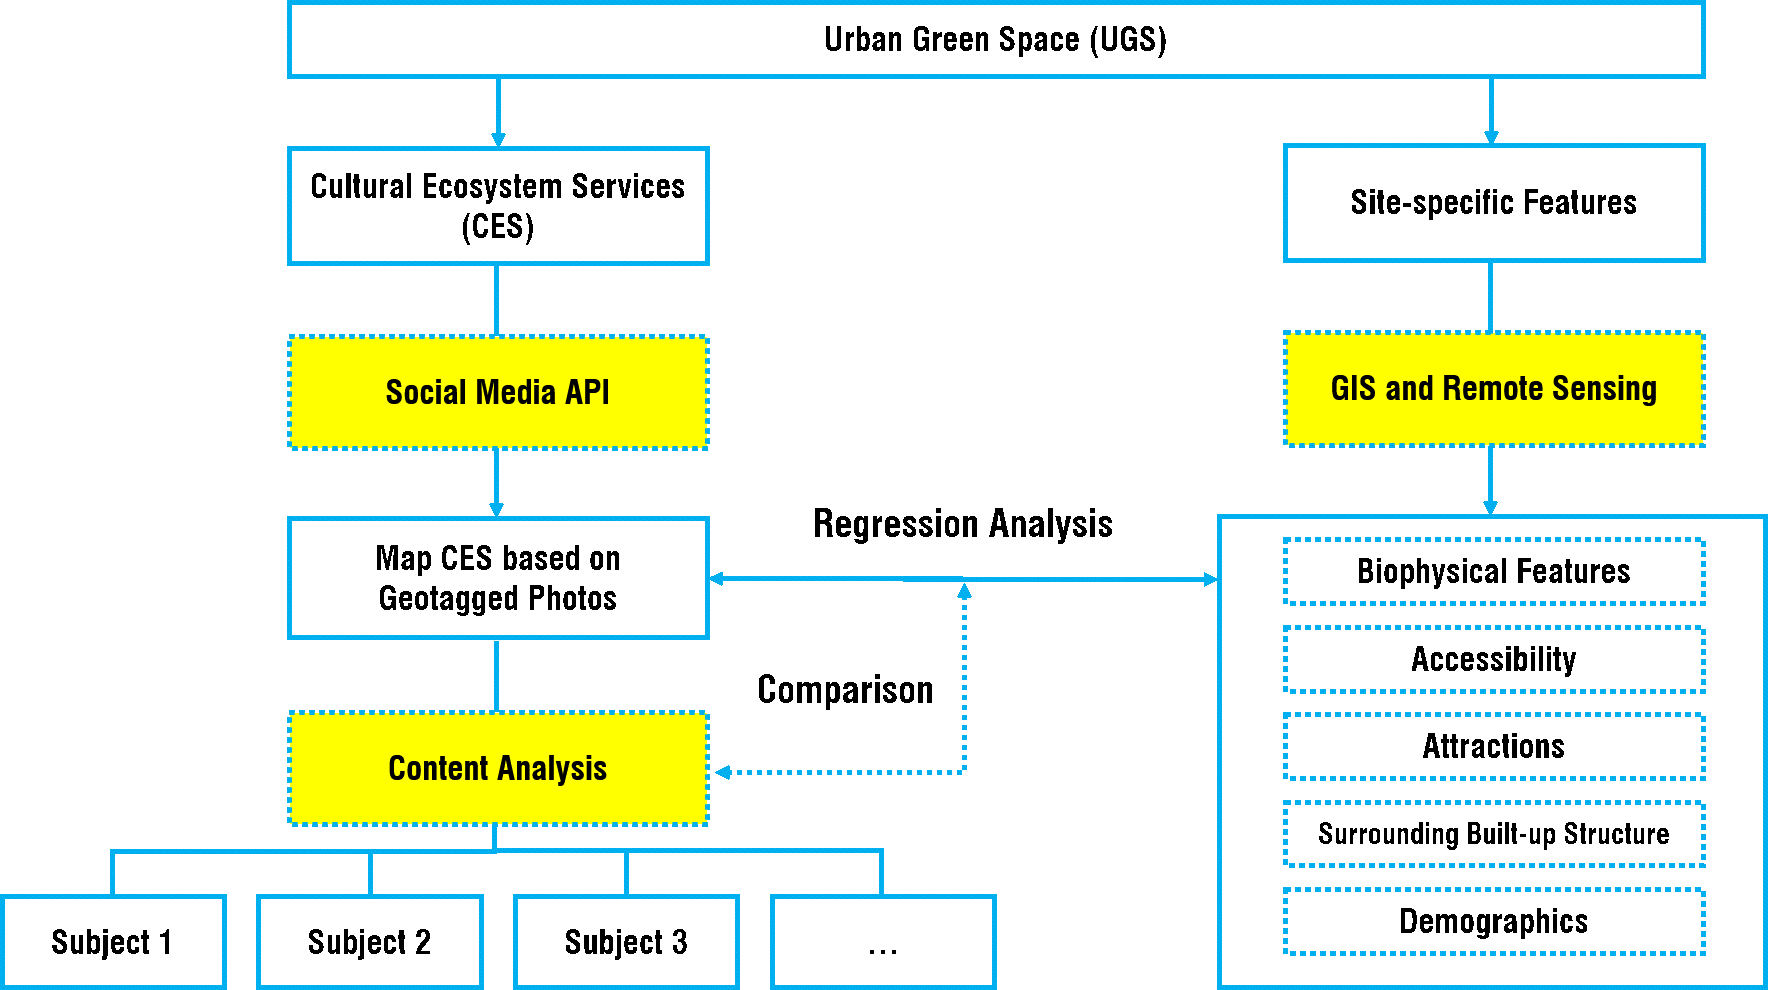
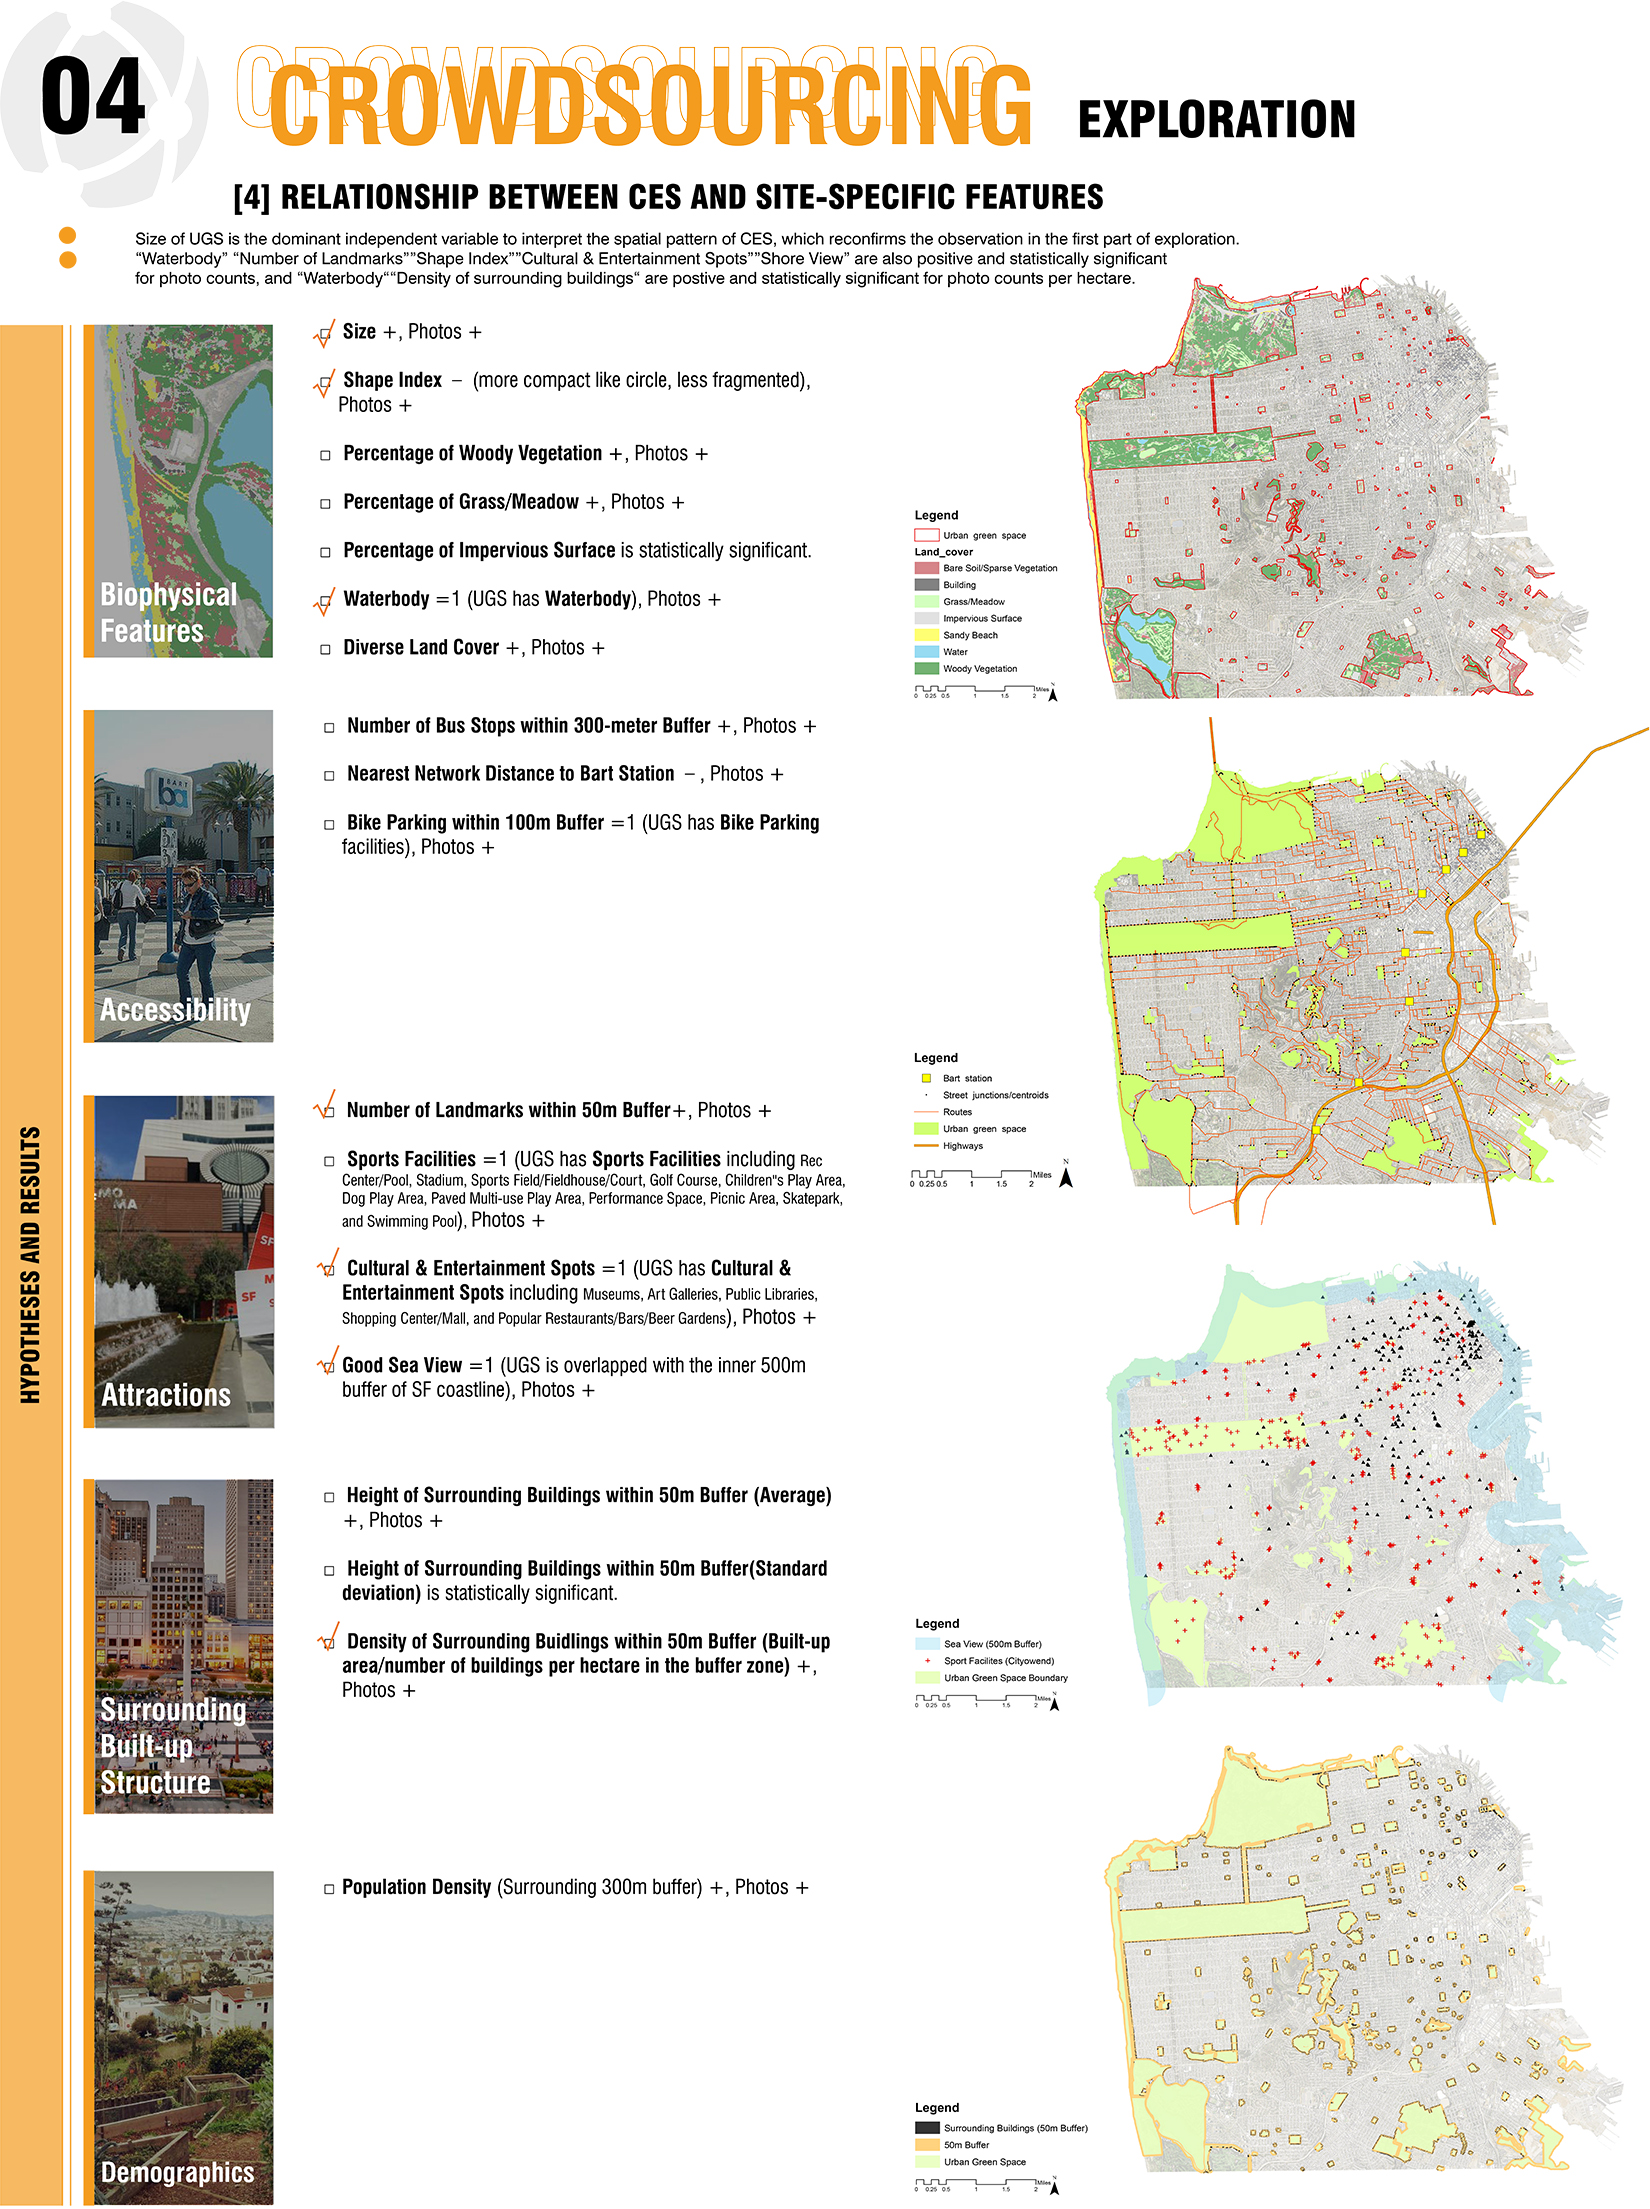
Results & Conclusion: Findings showed that the spatial patterns of CES quantified by photo counts and photo counts per hectare in UGS were quite different, but both of them were meaningful and necessary for assessing CES. UGS located in less dense area with a larger size, more disaggregated shape, more landmarks, waterbody, cultural and recreation spots, as well as a potential sea view were probably to get more photo counts, while UGS with waterbody, higher building and population density in surrounding neighborhoods could have more photo counts per hectare in San Francisco. The CES composition across all UGS in San Francisco varied a lot due to different site-specific features, which was reflected by diverse subjects of photos. These results could be used by environmental planners to understand city dwellers’ preferences and behaviors in UGS at a large scale with lower costs compared to traditional approaches, and compare the trade-offs across different options of site-specific feature changes in UGS.