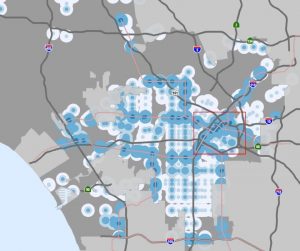
Siting of Los Angeles Multifamily Development by Unit Size (2014-2018)
Background
This map shows area median income by census tract in Los Angeles County and the number of units of each development, represented by a dot. I created this map for a research project I’m working on about Los Angeles’ Measure JJJ. The data is from the American Community Survey (2016) and building permit applications from the City of Los Angeles (2014-2018). The data on median income lags behind a bit – but it’s the most up to date information I have access to.
The Audience
This map is a contextualizes where overall multifamily development, both market rate and affordable, has occurred within the last four years, using units number as a proxy for density. The purple and green darkens as development units density and income increases, respectively. My audience is planners, policymakers, and anyone interested in development patterns in Los Angeles. Hopefully, they’ll be able to find this map useful by recognizing that much high density development occurs where low income communities live, and consider the impacts an increase in density.
The Story
Most multifamily development between the last four years has been relatively high density. 2-10 unit developments comprise of a small share of all developments on the map. However, a concentration of smaller and mid sized multifamily development is seen in Venice, Westwood, Brentwood, and South Carthay. A concentration of the highest density development category, at 250+ units, is present in the Financial District and the Arts District. To the east, Koreatown also bolsters a mix of high density development, as most of the recent multifamily development comprises of 50+ units. There has virtually been no multifamily building activity in South LA. Of course, zoning determines density allowances, but the introduction of Measure JJJ will enable developers to seize upon generous zoning incentives within a half a mile of a “majority transit stop”, which the LA Planning Department defines here. Measure JJJ may reinforce existing development patterns in downtown LA, while possible increasing density in South LA.
TOC sheds for development incentives
Source: LA Planning Department
Why it Matters
Although this map does not differentiate between market rate and affordable development, current tools to incorporate affordable housing within the housing market in LA, such as density bonuses and Measure JJJ incentives, may not provide enough affordable units for existing residents. State legislators are currently revising SB 827 after the bill died in committee after two unlikely groups formed a strange alliance to stop the bill’s passage – tenant advocates concerned about the effect of increasing density on low income tenants living in affordable unsubsidized housing and what many would called “NIMBYs”. I personally align with the former. Although SB 827 contained some of the strongest anti-displacement provisions thus introduced by Scott Wiener, many state they were not enough to stop eventual and inevitable removal of existing, cost burdened renters if development were to drastically upzone.
Process
I brought in a shapefile of Los Angeles census tracts with AMI information embedded. Since we’ll be learning geocoding in the upcoming weeks, I geocoded addresses using ESRI’s tool in ArcGIS, which creating fields within the tabular data on latitude and longitude. I connected this dataset in Carto, and used CartoCSS to create my own numerical intervals and breaks (something that Carto is not very flexible with!). It was a surprise to me that Carto does not have a user friendly way to manually change data intervals, but only allows Jenks, natural breaks, quantiles, etc.