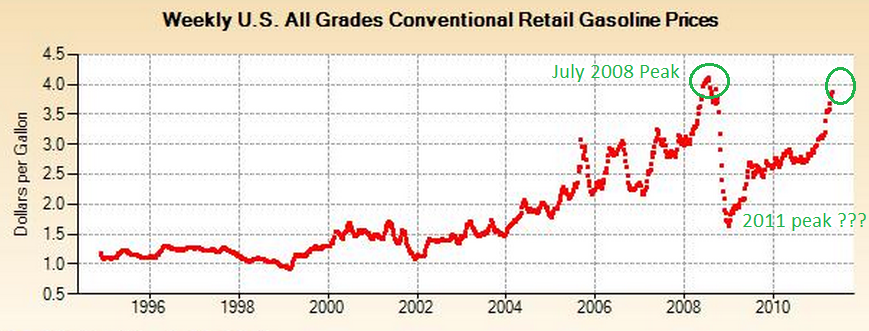
Gasoline prices in the United States have been breaking into new inflation-unadjusted territory lately. I pulled some data from the United States’ Energy Information Administration (EIA) that suggests a not so comfortable summer this year. Lets take a quick look at one of EIA’s graphs:
http://eia.doe.gov/dnav/pet/hist/LeafHandler.ashx?n=PET&s=EMM_EPM0U_PTE_NUS_DPG&f=W
If we peer into the actual numerical data, we can observe that average all-conventional U.S. retail gasoline prices over the fourth week of April 2011 (ending April 25) had a mean price of $3.867.
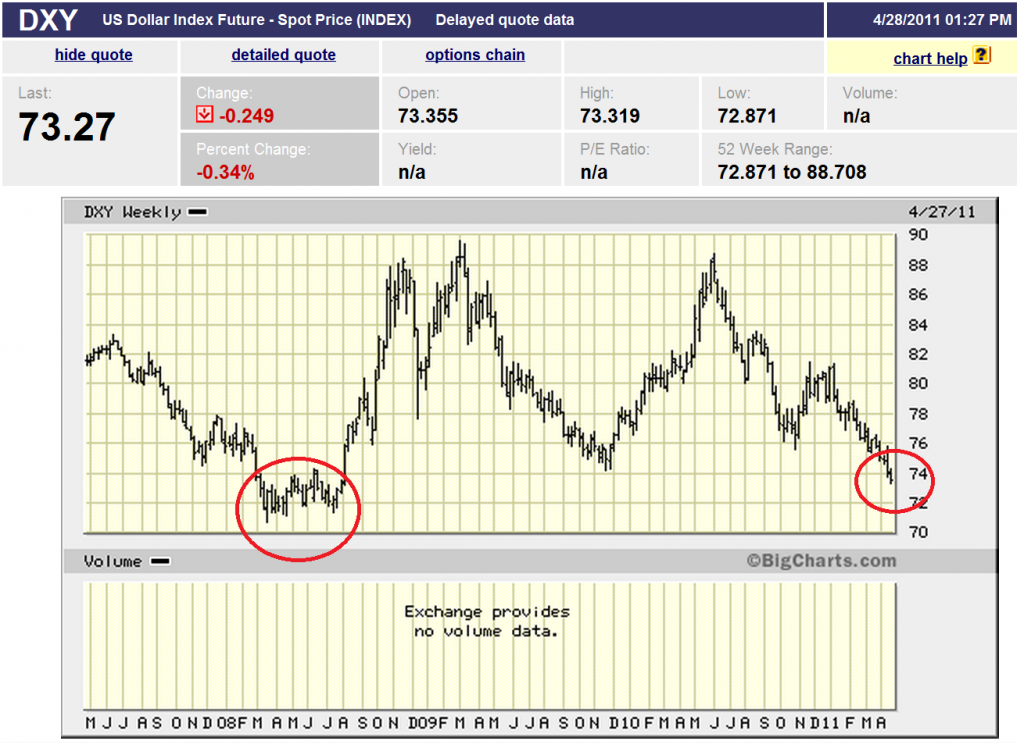
Since the value of the dollar right now is close to what the value of the dollar was during the depths of the liquidity crisis in 2008, I would argue that this is a valid enough reason to compare U.S. gasoline price trends today to price trends in the first half of 2008. The value of the dollar in international currency markets seems to negatively correlate enough with gasoline prices to be used as a complementary metric of the other (I’m too lazy to do the statistics for that right now).
 http://bigcharts.marketwatch.com/quickchart/quickchart.asp?symb=dxy&insttype=&freq=2&show=&time=11&x=0&y=0
The U.S. Dollar Index tracks a basket of international currencies against the U.S. dollar. Since quite a bit of oil is exchanged for dollars in commodities markets, it might be useful to also note that the value of the dollar right now is only 1.3% more than the value of the dollar during April of 2008, only marginally worth more since the recession. Initially, I was led to think that gas prices were perceived by Americans to be high simply because the dollar was weaker which would mean that it would cost more in dollars to purchase a barrel of oil that would drive up the input costs to produce a gallon of gasoline. But gasoline prices year-over-year from April 2008 to April 2011 have gone up by 6.97%–far outpacing the 1.3% rise in the dollar’s worth (which currently has a downward trajectory) as well as outpacing the 2.5% inflation rate from 2008 to 2011.
Although building forecasting models from somewhat causal relationships between currencies and goods is more complex than this, we’ve at least ruled out the “weak dollar hypothesis.” If we run with the assumption that the U.S. Dollar Futures Index and gasoline prices are negatively correlated anyways, we might get a tiny sense of where gasoline prices in the United States could potentially head in a worst-case, recession style situation:
The circled table cell shows that we paid during the fourth week of April 2008 an average price of $3.615. Notice also the HUGE plummet in prices to $1.685 in December 2008. I suspect that this was due to the U.S. Federal Reserve’s 1st round of quantitative easing maneuvers (QE1) that began in November 2008.
If we look at the rate of change in month-over-month retail gasoline prices of the fourth week of each month from January-July 2008, prices went up 5.38% on average for each month in that series. If we assume the same average rate of change in month-over-month prices of the fourth week of January until the expected mid-July peak in 2011, we can potentially see gasoline prices hitting a weekly average of $4.294 this summer and then retreating afterwards. But of course there are other factors that could contribute to how prices accelerate or decelerate from now until the end of summer. The Middle East and North Africa is going to be on everyone’s minds (even though there is no reason it should, but that’s an entirely separate conversation) as well as hurricane season in the Gulf Coast.


