
By Miya Rosenthal
Asian Pacific Islander Desi Americans (APIDAs) are often portrayed as an American success story, with the statistically highest median income and wealth of any ethnoracial group in the United States [1]. However, this narrative overlooks the reality of the severe income and wealth gap within the APIDA community, with households in the top 10% of wealth having 168 times the wealth of households in the bottom 20% [1], [2]. This disparity is more severe than that experienced by African and Latinx Americans, yet APIDA poverty remains underreported and often ignored by policymakers and the public [3].
Intraethnic variation depends on vastly different immigration statuses, levels of education, employment outcomes, as well as access to resources and opportunities. Pinpointing APIDA poverty and unpacking these intraethnic complexities is made more difficult without sufficient data to properly track it, let alone good policy to alleviate it.
One primary challenge in addressing APIDA poverty is the failure of government agencies and independent researchers to collect granular data that reflects the diversity within the APIDA community. Statistics on APIDAs are often reported in aggregate—if they are reported at all—thereby erasing the high poverty rates experienced by many APIDA subgroups, such as Southeast Asian refugees, in official data sets. For example, while 12% of all APIDAs live below the poverty line, nearly 40% of Burmese Americans do [3]. Native Hawaiians and Pacific Islanders have a known high incidence of poverty but there is a lack of robust data to quantify it accurately. Failing to recognize intraethnic APIDA diversity results in data and subsequent policies and services that ignore segments of the APIDA population living in poverty, exacerbating economic inequality.
The pervasive “model minority” myth, which paints APIDAs as naturally successful and self-sufficient, further perpetuates the erasure of APIDA poverty. This myth glosses over the significant barriers that many APIDAs face, including workplace discrimination, uneven access to quality education, and language isolation. In 2014, APIDAs represented 18% of New Yorkers living below the poverty line—the highest rate of any ethnoracial group—yet APIDA community organizations received less than 2% of total contract dollars from New York City’s Department of Social Services [3].
Additionally, the model minority myth attaches a stigma to receiving social services, erecting barriers for eligible APIDAs to access much-needed resources. Nationally, less than half of APIDAs who qualify for Supplemental Nutrition Assistance Program (SNAP) benefits receive them, despite research showing SNAP substantially reduces poverty and food insecurity [3]. The lack of tailored aid exacerbates the problems of poverty and inequality, making it more difficult for families and individuals to break out of cycles of poverty.
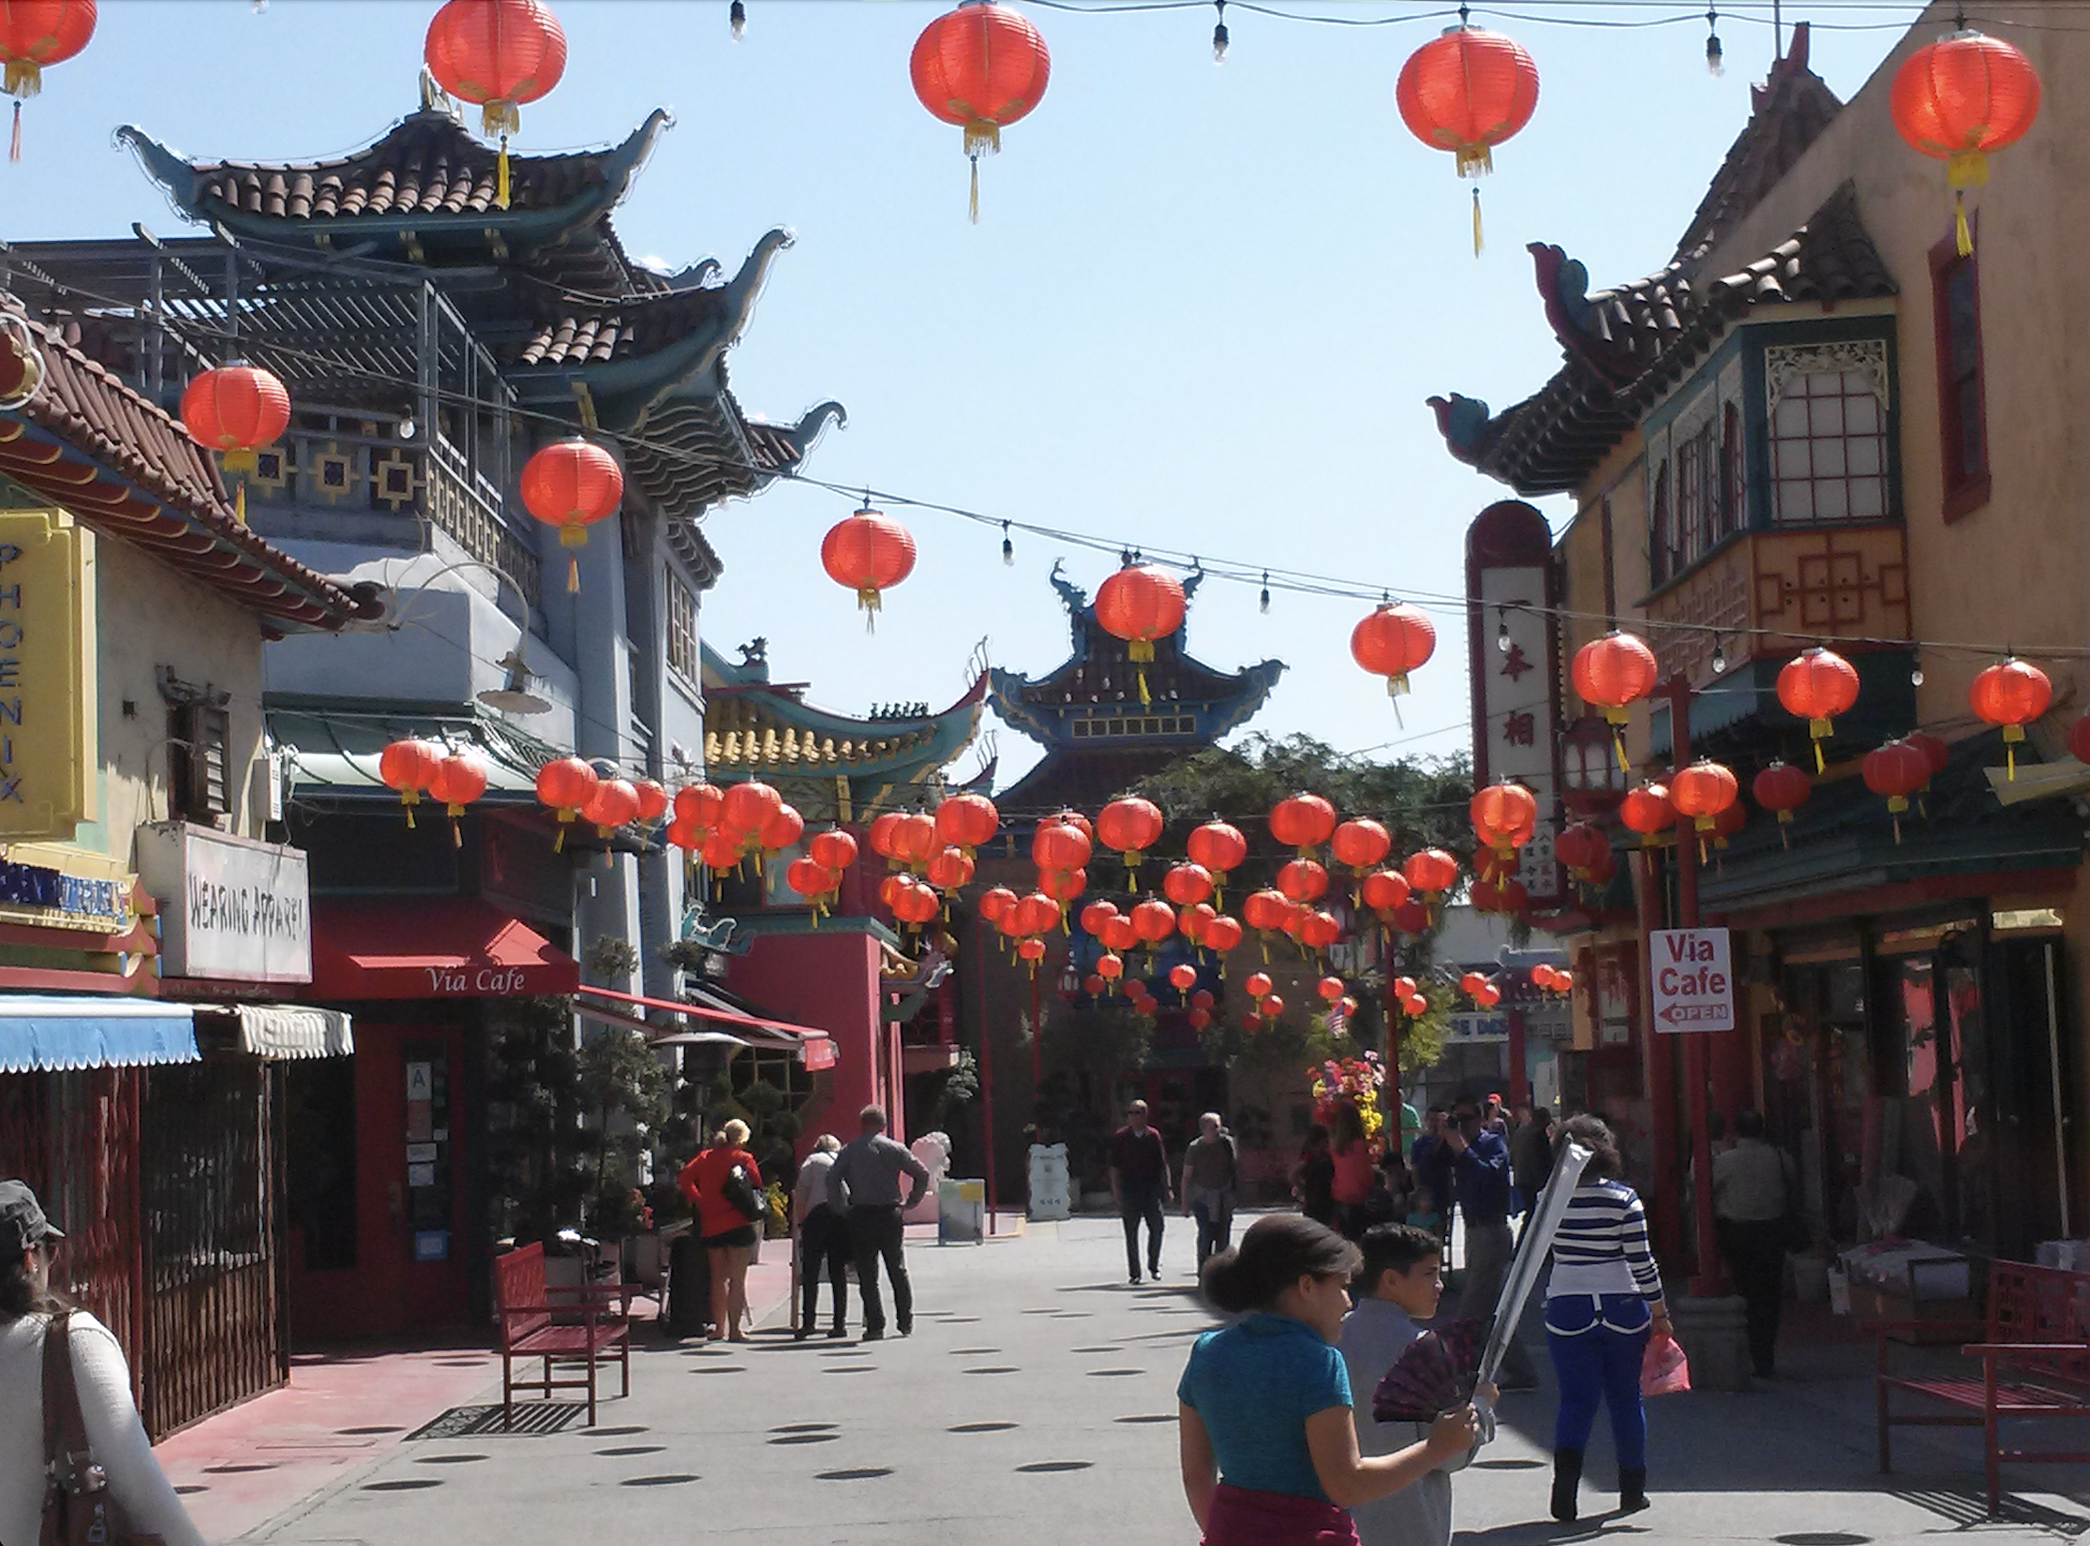
In Los Angeles, intraethnic wealth disparity among APIDAs is especially stark. APIDAs comprise 15% of the County population—one of the highest concentrations nationwide—with the largest ethnic groups being Chinese, Filipino, Korean, Japanese, Vietnamese, and Indian [4]. Median net worth varies dramatically across these groups. While median wealth for Japanese, Indian, and Chinese Angelenos exceeds that of whites (over $355,000), Filipinos, Vietnamese, and Koreans are on par with the median wealth of African and Latinx Americans [5]. Nonetheless, even generalizing the broad prosperity of certain East Asian ethnicities fails to capture pervasive economic disparity. The median Japanese Angeleno is worth 25 times more than the median Korean Angeleno. Further, Chinatown is Los Angeles’ third poorest neighborhood, with over half of households earning under $20,000 annually [5], [6].
Addressing this complex issue demands proactive policy change centering on the needs of low-income APIDA communities. Necessary interventions include investment in granular data collection and analysis, culturally competent social services, and deep community partnerships. Disaggregating data across the manifold APIDA ethnicities and socioeconomic strata—and funding services in response—can help combat economic marginalization experienced by subsets within the APIDA umbrella. For instance, the Asian American Pacific Islander Small Business Program assists with developing Asian-owned small businesses in Los Angeles, working closely with local Chinese, Cambodian, Korean, Japanese, Thai, and Filipino community organizations. Contracting with grassroots entities with preexisting trusting relationships is a targeted and proven approach to alleviating APIDA economic insecurity and building wealth for immigrant families, cultural communities, and the County at large.
We must collectively acknowledge the reality of poverty among APIDAs across ethnicities, recognize the diversity within the broad APIDA framing, and strive to break down systemic barriers facing APIDA subgroups. With APIDAs representing the fastest-growing racial population in the United States, more than doubling since 1970, the problem of economic marginalization and inequality will only continue increasing without attention from policymakers and public investment [4]. Supporting small businesses and social programs tailored to low-income APIDAs can create avenues for economic mobility and ensure that all members of APIDA communities have access to the resources needed to thrive.
Works Cited
- Nadeau, Sarah, et al. “Wealth Inequality among Asian Americans Greater than among Whites.” Center for American Progress, 21 Apr. 2023, https://www.americanprogress.org/article/wealth-inequality-among-asian-americans-greater-than-among-whites/.
- Kochhar, Rakesh. “Income Inequality in the U.S. Is Rising Most Rapidly among Asians.” Pew Research Center’s Social & Demographic Trends Project, Pew Research Center, 21 Aug. 2020, https://www.pewresearch.org/social-trends/2018/07/12/income-inequality-in-the-u-s-is-rising-most-rapidly-among-asians/.
- Tran, Victoria. “Asian Americans Are Falling through the Cracks in Data Representation and Social Services.” Urban Institute, 19 June 2018, https://www.urban.org/urban-wire/asian-americans-are-falling-through-cracks-data-representation-and-social-services#:~:text=In%202015%2C%202.6%20percent%20of,and%20other%20public%20assistance%20programs.
- An Economic Profile of the Asian Community in Los Angeles County. Los Angeles County Economic Development Corporation, Jan. 2017.
- De La Cruz-Viesca , Melany, et al. Color of Wealth in Los Angeles. Federal Reserve Bank of San Francisco, 2016, https://www.frbsf.org/wp-content/uploads/sites/3/color-of-wealth-in-los-angeles.pdf.
- Mapping L.A. $20,000 or Less. Los Angeles Times, https://maps.latimes.com/neighborhoods/income/20-or-less/neighborhood/list/index.html.


Be First to Comment