Introduction
Affordable and reliable transportation is crucial to connect people to not only economic opportunities but also everyday needs that range from grocery shopping to medical care. Transportation policies and projects have historically prioritized top-down approaches that emphasize efficiency, which consequently marginalize low-income and communities of color. The transportation planning field has been moving away from the top-down approach and towards a community-based approach where planners are incorporating stakeholders’ input to shape transportation projects. Community engagement has taken several forms, such as interactive workshops, tabling at community events, and online surveys.
While the transportation project planning process is evolving to better reflect actual community concerns and priorities, project goals and metrics, which guide project implementation and indicate project success, have not evolved at the same pace. Given limited time and budgets, metrics often prioritize increasing throughput (e.g. vehicles per hour) or speed, which effectively prioritizes efficiency and can fail to accurately represent how a project impacts marginalized communities. For my Professional Report, I am developing an evaluation framework, or toolkit, to help transportation planners incorporate equity into transportation project performance metrics. I interviewed transportation planners, reviewed existing transportation plans and did a literature review of research papers about incorporating equity into planning.
Background
In the United States, equity has been incorporated into transportation planning through several federal policies. Title VI of the Civil Rights Act of 1964 prevents programs and activities receiving federal funding, such as public transportation service, from discriminating people based on race, color, or national origin[i]. The Americans with Disabilities Act of 1990 ensures equal opportunity and access, such as for transit stop or platform access, for persons with disabilities[ii]. Executive Order 12898, “Federal Actions to Address Environmental Justice in Minority Populations and Low-Income Populations,” of 1994 requires all federal agencies to incorporate environmental justice into their mission by identifying and addressing the adverse human health or environmental effects of their programs, policies, and activities on minority and low-income populations[iii]. Lastly, the Transportation Equity Act for the 21st Century (TEA-21) of 1998 dedicates funding to improve accessibility and improves public involvement in planning processes[iv].
Incorporating equity into transportation policies and planning has been an emerging focus for the last decade with an increased emphasis in the last five years. A variety of research institutes, advocacy organizations, and practitioners have been contributing equity definitions and implementation strategies. The Victoria Transport Policy Institute frames equity into two broad perspectives: horizontal and vertical equity. Horizontal equity, also referred to as egalitarianism, considers the distribution of impacts among groups considered equal in ability and need. Vertical equity, also referred to as social justice, considers the distribution of impacts among individuals and groups that differ in ability and need. Vertical equity can focus on differences in socioeconomic status or mobility ability and need[v]. TransitCenter, a foundation to improve urban mobility, defines transportation equity as ensuring benefits accrue more and burdens accrue less in low-income and communities of color than the population in general[vi]. Chris McCahill and Mary Ebeling from the University of Washington’s State Smart Transportation Initiative find that transportation equity has historically focused on economic impacts, such as fees and funding. McCahill and Ebeling also find that transportation equity is evolving to focus on accessibility (i.e. the relationship between land use and transportation) and shifting from measuring equity through outputs to outcomes[vii]. Lastly, the Greenlining Institute, a research institute focused on racial and economic justice, define mobility equity as a transportation system that provides high quality mobility options, reduces air pollution, and improves economic opportunity in low-income communities of color[viii]. The research has an overarching theme that incorporating equity means considering the distribution of benefits and costs and the varying levels of access for specific populations. This report applies a vertical equity lens on metrics that account for socioeconomic and mobility differences and outcomes.
In July 2012, President Obama passed the Moving Ahead for Progress in the 21st Century Act (MAP-21), which approved funding for surface transportation programs. MAP-21 requires metropolitan planning agencies (MPO) to set performance measures and targets that will guide states to “invest resources in projects that collectively will make progress toward the achievement of national goals.” The national goals are grouped into seven categories: safety; infrastructure condition; congestion reduction; system reliability; freight movement and economic vitality; environmental sustainability; and reduced project delivery delays[ix]. The requirement for MPOs to develop performance metrics for metropolitan transportation plans and transportation improvement programs has trickled down to other city and county transportation projects and plans regardless if they are tied to MPO-distributed funding. In other words, performance measures have become an expected component of transportation planning. Performance measures have also become an essential component of transportation projects and plans due to dwindling sources for transportation funding (e.g. stagnating fuel tax revenue) that result in limited budgets that need to be used efficiently and effectively.
In response to the growing presence and demand for performance metrics, multiple research institutions have provided recommendations for goals and indicators. The Bipartisan Policy Center’s National Transportation Policy Project identifies five overarching goals that should be incorporated into performance metrics: economic growth, national connectivity, metropolitan accessibility, safety, and energy security and environmental protection[x]. The Victoria Transport Policy Institute recommends several categories to track distributional impacts of transportation projects: public facilities and services; user costs and benefits; service quality; external impacts; economic impacts; and regulation and enforcement[xi]. The various performance measure guidelines have three common themes: improving safety, acknowledging the relationship between transportation and economic growth, and increasing environmental sustainability. These themes point to the importance of shifting the transportation planning focus from prioritizing mobility and auto travel to prioritizing access and multimodal travel.
The Evaluation Framework
I used my research to compile a table of metrics that are summarized into 4 measure groups with key questions. The table below shows measure groups with a subset of metric themes associated with each measure group.
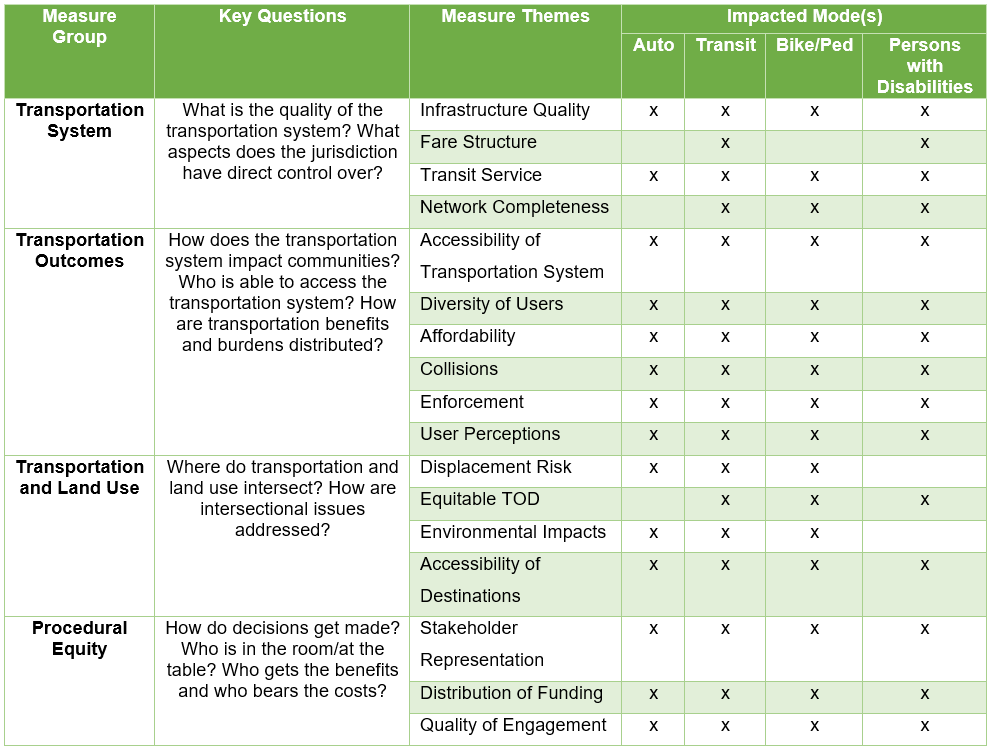
Since each community has unique priorities and goals, this evaluation framework should serve as a starting point for developing final performance metrics. Just as the project development process is moving towards a community-based approach, identifying performance metrics should also incorporate a community-based approach.
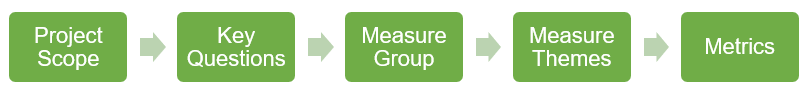
Selecting Metrics
The Evaluation Framework currently has 34 metrics. To select relevant metrics, a user can see which key questions best relate to the project scope then identify which themes are most relevant to the project within the measure group. The metric-selection workflow is illustrated below:
Creating Metrics
My goal is to develop an interactive, web-based tool that generates each performance metric for specified geographies and time frames. The interactive tool will not only help reduce the time required for acquiring, cleaning, and analyzing the data but will also improve community engagement by making data more accessible.
Since I don’t possess all the necessary skills to create an interactive, web-based tool yet, I’m taking an incremental approach to developing the tool. I’m starting with writing the python scripts and workflows to generate each metric. I will be posting my work on my GitHub as an open-source tool. At a minimum, my Professional Report will instruct readers how to set up their computers with the appropriate software to download and run the jupyter notebooks on my GitHub. I will be learning html to create the web-based tool that is built upon the metrics I began setting up in this class.
Building the Toolkit: Transportation Outcomes Metrics
I selected a few metrics in the Transportation Outcomes Measure Group to apply the skills I gained through this class. I applied the metrics on Los Angeles County as my case study region.
1. Poverty Rate by Census Tract
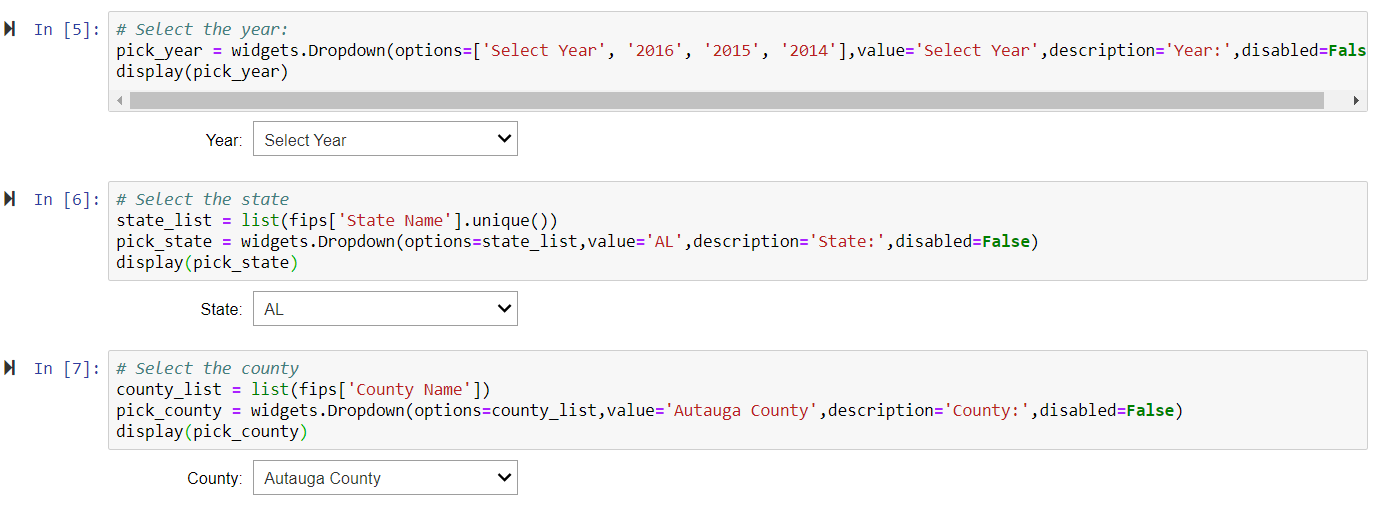
Calculating the poverty rate by census tract falls under the “Diversity of Users” measure theme. The jupyter notebook features drop down menus so the user can select the desired year, state, and county to query the Census API to calculate poverty rate by census tract for the selected county. The drop down menus further reduce the barriers to creating this metric because the user doesn’t need to know Python. A screenshot of the drop down menus are shown below because they don’t show up on the jupyter notebook preview on GitHub.
The jupyter notebook calculating poverty rate by census tract guides the user to generate an interactive map using Mapbox GL, which can be embedded on a website, as shown below:
Poverty Rate by Census Tract for Los Angeles County (2016)
2. Percent of Households with No Vehicle and Collisions Involving Bicyclists and Pedestrians
In looking at the percent of households with no vehicle (by census tract) and the collisions involving bicyclists and pedestrians, the underlying metric is tracking the number of collisions involving bicyclist and pedestrians, which falls under the “Collisions” theme. The hypothesis of this spatial relationship is that census tracts where a large percentage of households don’t own a vehicle will have more collisions involving bicyclists and pedestrians because residents are walking, biking, and taking transit more frequently than tracts with lower rates of households with no vehicle. The factors that influence the amount people walk, bike, and take transit are more complex than just vehicle ownership, but the analysis, as shown in the map below, provides one perspective.
Percent of Households with No Vehicle and Collisions Involving Bicyclists and Pedestrians for Los Angeles County (2016)
The map is created in Carto, which has the functionality to visualize multiple layers and toggle the layers on and off. The percent of households with no vehicle was generated in this jupyter notebook, which uses the Census API to get household vehicle ownership data. The collision data was manually downloaded from SafeTREC’s Transportation Injury Mapping System (TIMS) because an API for collision data does not yet exist. For reference, the collision data used in the Carto map above is also uploaded on my GitHub.
3. Commute Mode
Tracking commute mode share falls under the “Accessibility of Transportation System” theme. Similar to the second metric, the commute mode share metric is visualized in Carto so users can toggle between modes. The commute mode share was generated in this jupyter notebook, which uses the Census API.
Commute Mode Share by Census Tract for Los Angeles County (2016)
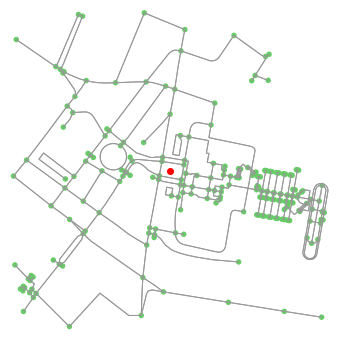
4. Bicycle and Pedestrian Access Shed
Calculating the bicycle and pedestrian access shed from a transit station, transit stop, or project site also falls under the “Accessibility of Transportation System” theme. The jupyter notebook, which uses OSMnx, simply requires the user to input a latitude and longitude to generate a map that shows a quarter-mile access shed for pedestrians and another map that shows a half-mile access shed for bicyclists. The jupyter notebook saves the two maps so the user can overlay them on other maps (e.g. using Adobe Illustrator). The two maps are shown below:
Quarter-Mile Walking Access Shed from Los Angeles Union Station
Half-Mile Bicycling Access Shed from Los Angeles Union Station

This metric could be further developed by calculating the number of homes and jobs that can be reached within a specified distance (e.g. quarter-mile) or specified time frame (e.g. 15 minutes) by specified modes (e.g. walking, biking, transit, driving).
Next Steps:
I will continue working on creating jupyter notebooks for each metric and post them to my GitHub. I will refine the jupyter notebooks I created for this project to have more interactive aspects like the drop down menus to make the metric creation process as easy and straightforward as possible. As mentioned earlier in this post, my ultimate goal is to create an interactive, web-based tool where users can specify a geography and view metrics for that geography. Overall, I hope to contribute to the transportation planning field by creating a resource that not only supports the growing demand for performance metrics but also supports the inclusion of equity into more aspects of transportation planning.
Notes:
[i] Federal Transit Administration. Title VI of the Civil Rights Acts of 1964, webpage.
[ii] Federal Transit Administration. Americans with Disabilities Act, webpage.
[iii] U.S. Department of Transportation. Executive Order 12898.
[iv] Federal Highway Administration. Transportation Equity Act for the 21st Century, webpage.
[v] Litman, Todd. “Evaluating Transportation Equity.” Victoria Transport Policy Institute, p. 4.
[vi] TransitCenter. “Inclusive Transit: Advancing Equity Through Improved Access and Opportunity,” 15.
[vii] McCahill, Chris et al. “Tools for measuring accessibility in an equity framework,” 1.
[viii] Greenlining Institute, “Mobility Equity Framework,” 4.
[ix] Federal Highway Administration, Moving Ahead for Progress in the 21st Century Act, webpage.
[x] National Transportation Policy Project, “Performance Metrics for the Evaluation of Transportation Programs,” 1.
[xi] Litman, Todd. “Evaluating Transportation Equity.” Victoria Transport Policy Institute, p. 4