The second type of geographic locations that are being used for this analysis are the 2,458 municipalities in Mexico and their corresponding classification under the marginalization index developed by the National Council of Population (CONAPO). This index takes into account education levels, housing conditions, income and density.
For more information about this index, visit the following link (in Spanish).
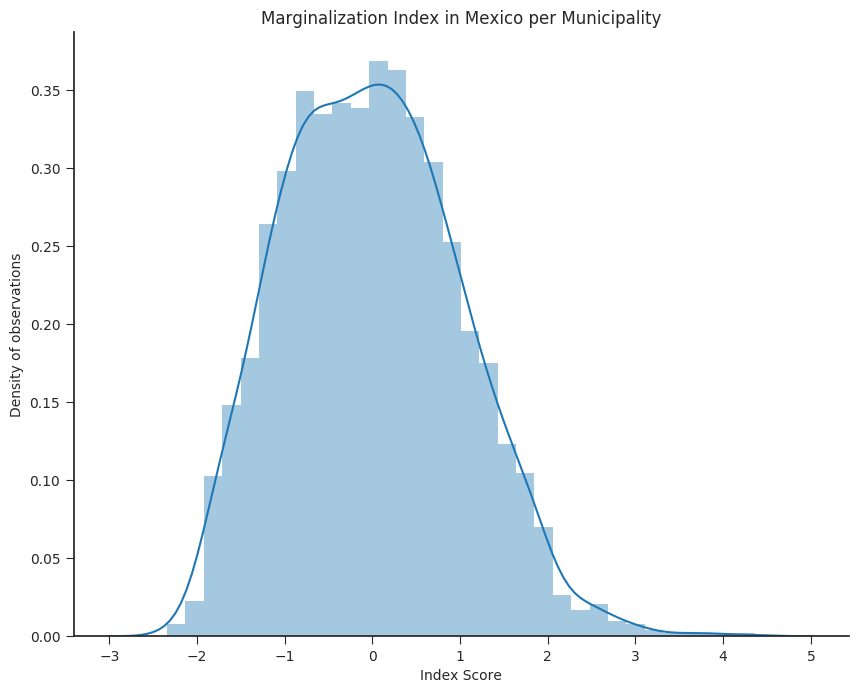
The distribution of the observations follows the path, for the most part, of a normal curve. The mean, mode and median cluster around the value of “0”, while the rest of the values go roughly from -3 to 4. The higher the value on this index for a specific municipality, the higher its levels of marginalization and viceversa.
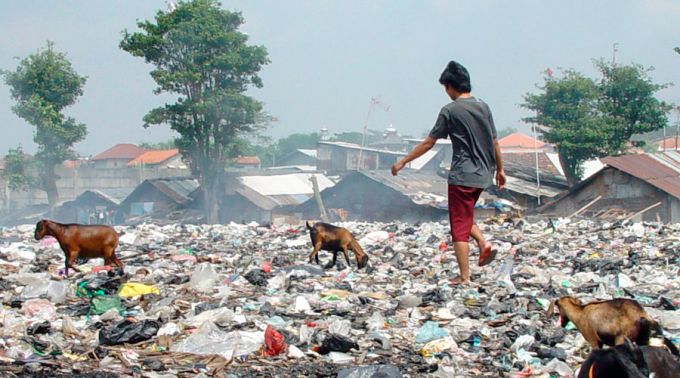
The following map shows the spatial distribution of these values. There is a clear relation between the urban a rural areas in Mexico. Rural areas in states like Oaxaca and Guerrero face significant levels of marginalization given their levels of isolation, lack of access to services like running water, electricity, but also education and health.
Even though the areas where indigenous populations concentrate tend to have a high correlation with areas were marginalization is also significant, the two variables do not explain each other. As it was previously mentioned, indigenous spatial data does not describe density dynamics. Additionally, Identifying as indigenous is not an aspect that is taken into account for the marginalization index: