Yiguang (Ethan) Xuan

Study route choice of drivers

Purpose

The purpose of this research is to identify factors that affect the route choice of drivers. This research helps improve the delivery of real-time information. It also helps us understand how driver behaves, leading to better traffic prediction and better control.

Data

  • Flow data (in [vehicle/hour] with 5-min aggregation) on both mainline and off-ramps from freeway loop detectors (Source: PeMS)
    Flow measurement locations
  • Messages posted on Changeable Message Signs (CMS) (Source: Caltrans CMS API)
    CMS 808866

Finding 1

CMS accident message does not have significant causal effect on route choice of drivers.

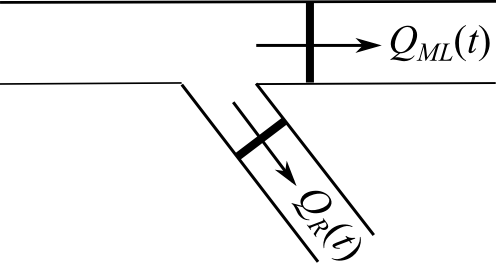
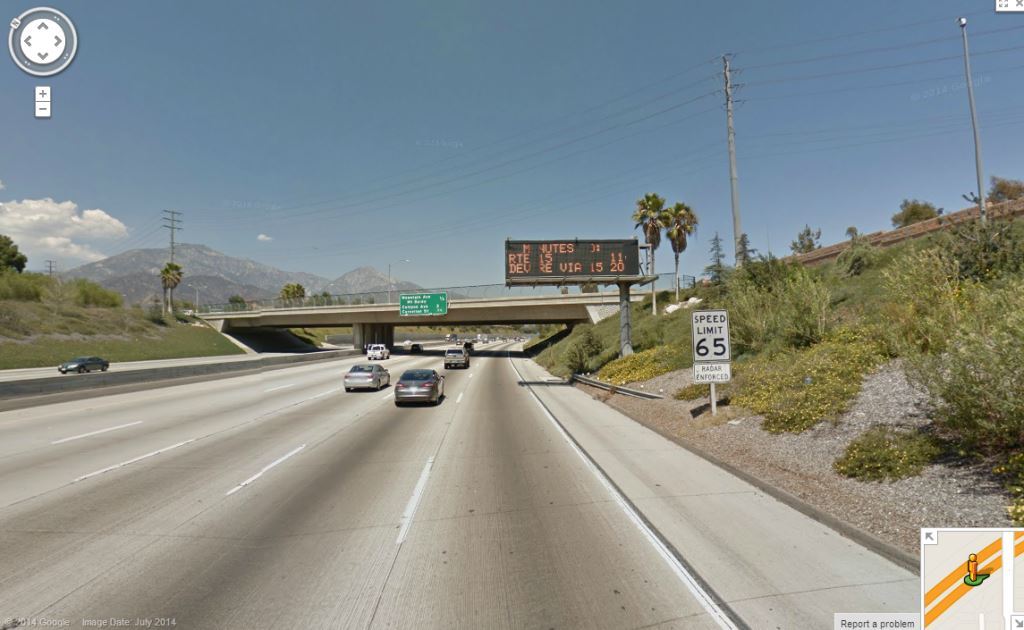
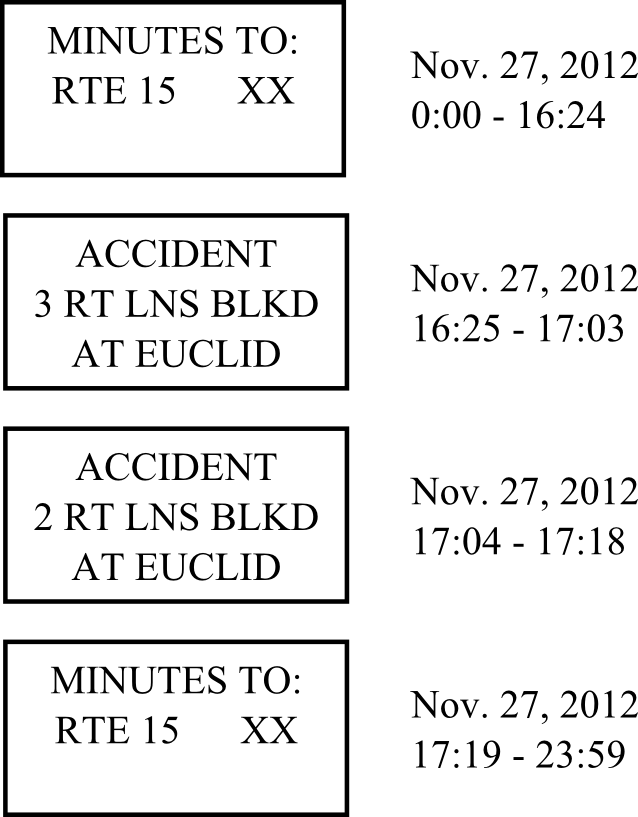
Here below is a case study to illustrate the point. This CMS displayed information about an accident at Euclid from 16:25 to 17:18. It displayed travel time during the rest of the time.

Message on CMS 808866 on Nov. 27, 2012

When the red curve is higher, more drivers change their route to take the next off-ramp instead of remaining on the freeway. You can see the route choice of drivers actually happens before the accident message is displayed.

Turning rate at Mountain Ave. on Nov. 27, 2012

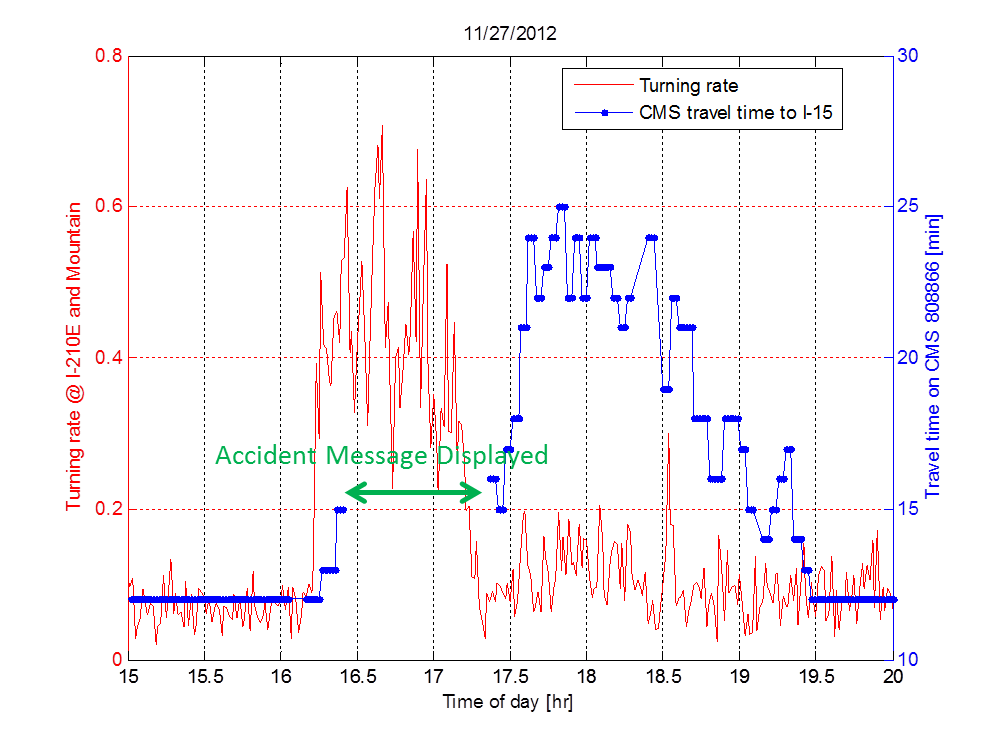
Statistical analysis based on correlation is not appropriate here. See Xuan & Kanafani (2014) for details on the causal statistical analysis, which is similar in nature to regression continuity.

Finding 2

Drivers are more likely to change their route and detour through nearby arterial streets when they see congestion on the freeway, i.e., drivers have to see it to believe it. Visual congestion (blue curve) seems to have a strong correlation with the route choice of drivers (red curve).

Turning rate at Mountain Ave. on Nov. 27, 2012

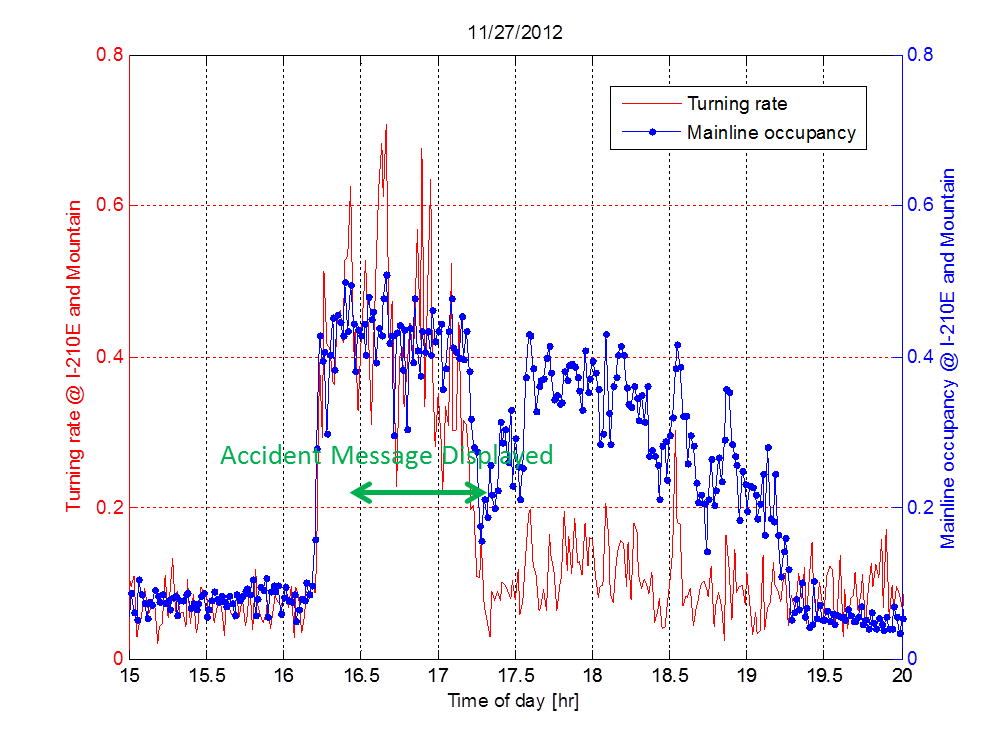
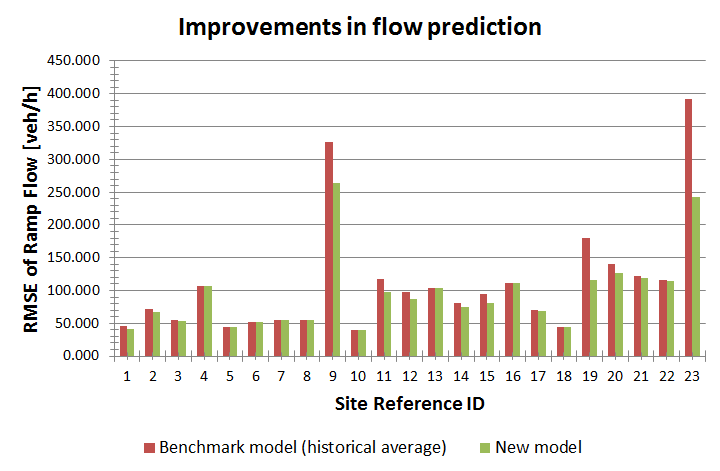
This finding is used to build a new model that can predict route choice of drivers based on mainline congestion level. When compared with the benchmark method that averages historical data, the new model performs better at all 23 sites across southern California.

Improvements in flow prediction

Representative publication

  • Xuan, Y., Kanafani, A. (2014). Evaluation of the Effectiveness of Accident Information on Freeway Changeable Message Signs: A Comparison of Empirical Methodologies. Transportation Research Part C: Emerging Technologies, in print. [Link] [PDF]
  • Xuan, Y., Kanafani, A., Modeling self-informed dynamic route choice of drivers, under draft.

Crowd source building maps with smartphones

Purpose

With Google Map, it is much more difficult to get lost. But you can still get lost in complex buildings. The purpose of this research is to explore the possibility to crowd source smartphone data to make indoor maps, which typically requires a lot of instrumentation.

Data

Volunteers walk multiple times inside buildings carrying the smartphones, which collect data from the following sources.

  • Accelerometer data (motion sensing) and magnetometer data (measuring ambient magnetic field) from Android phones (~46Hz)
  • Nike+ shoe sensor (estimating walking speed)
    G-Phone Shoe sensor

Algorithm

The algorithm to construct indoor map has the following key steps.

  • Determine phone orientation (X, Y and Z axes) from gravity (Z axis) and magnetic field (F axis).
    Phone orientation
  • Determine the AP, V, ML axes using principal component analysis: the first two principal components are the AP and V axes.
    Gait
  • Determine walking direction, with the following pattern in AP and V components.
    AP and V acceleration pattern
  • Determine walking speed using Nike+ sensor

Results

Trajectory from the algorithm above matches with the building in satellite image.

Trajectory with building overlay

With data from multiple walks on the same floor, the floor plan is estimated with a 3% relative error in distance and a 4 degree error in angle.

Estimated vs True Map

Representative publication

  • Xuan, Y., Sengupta, R., Fallah, Y. (2010). Crowd Sourcing Indoor Maps with Mobile Sensors. Paper presented at the 7th International ICST Conference on Mobile and Ubiquitous Systems (Mobiquitous 2010). [PDF]

Increase the flow capacity of a single intersection

The goal of this research is to increase the flow capacity of a single intersection. For oversaturated intersections, new designs may increase capacity and eliminate the spillover problem, which could otherwise lead to gridlock. Alternatively, the same amount of traffic demand at undersaturated intersections may be served with fewer lanes, facilitating dedicated lanes for greener modes like buses. Finally, understanding the limit of a single intersection is also of theoretical interest.

Consider a conventional, four-leg, at-grade intersection that serves left-turn vehicles and through vehicles from the same approach with separate phases. Conventional operation is not efficient with respect to capacity, because only the left-turn lanes discharge during the left-turn phase, and only the through lanes discharge during the through phase. Imagine instead how much more capacity could be realized if all approach lanes discharge during both phases. This situation would be possible if traffic streams can be reorganized, by a mid-block signal called pre-signal.

Improve bus punctuality through dynamic holding

The operation of buses without control is known to be unstable: the early buses need to pick up fewer passengers and thus will go even faster, and conversely the late buses will go even slower. This instability can be eliminated by inserting slack into the schedule, which reduces the average speed of buses. We have studied a dynamic holding strategy to eliminate instability with minimal reduction in average bus speed.