Chemistry 125, Spring 2007
Physical Chemistry Laboratory GSI Matt's Section
- Matt Graham
Office: B77 Hildebrand
Lab/Office Hours: M 1-5PM or by appointment
Email: werd *AT* berkeley.edu
Welcome!
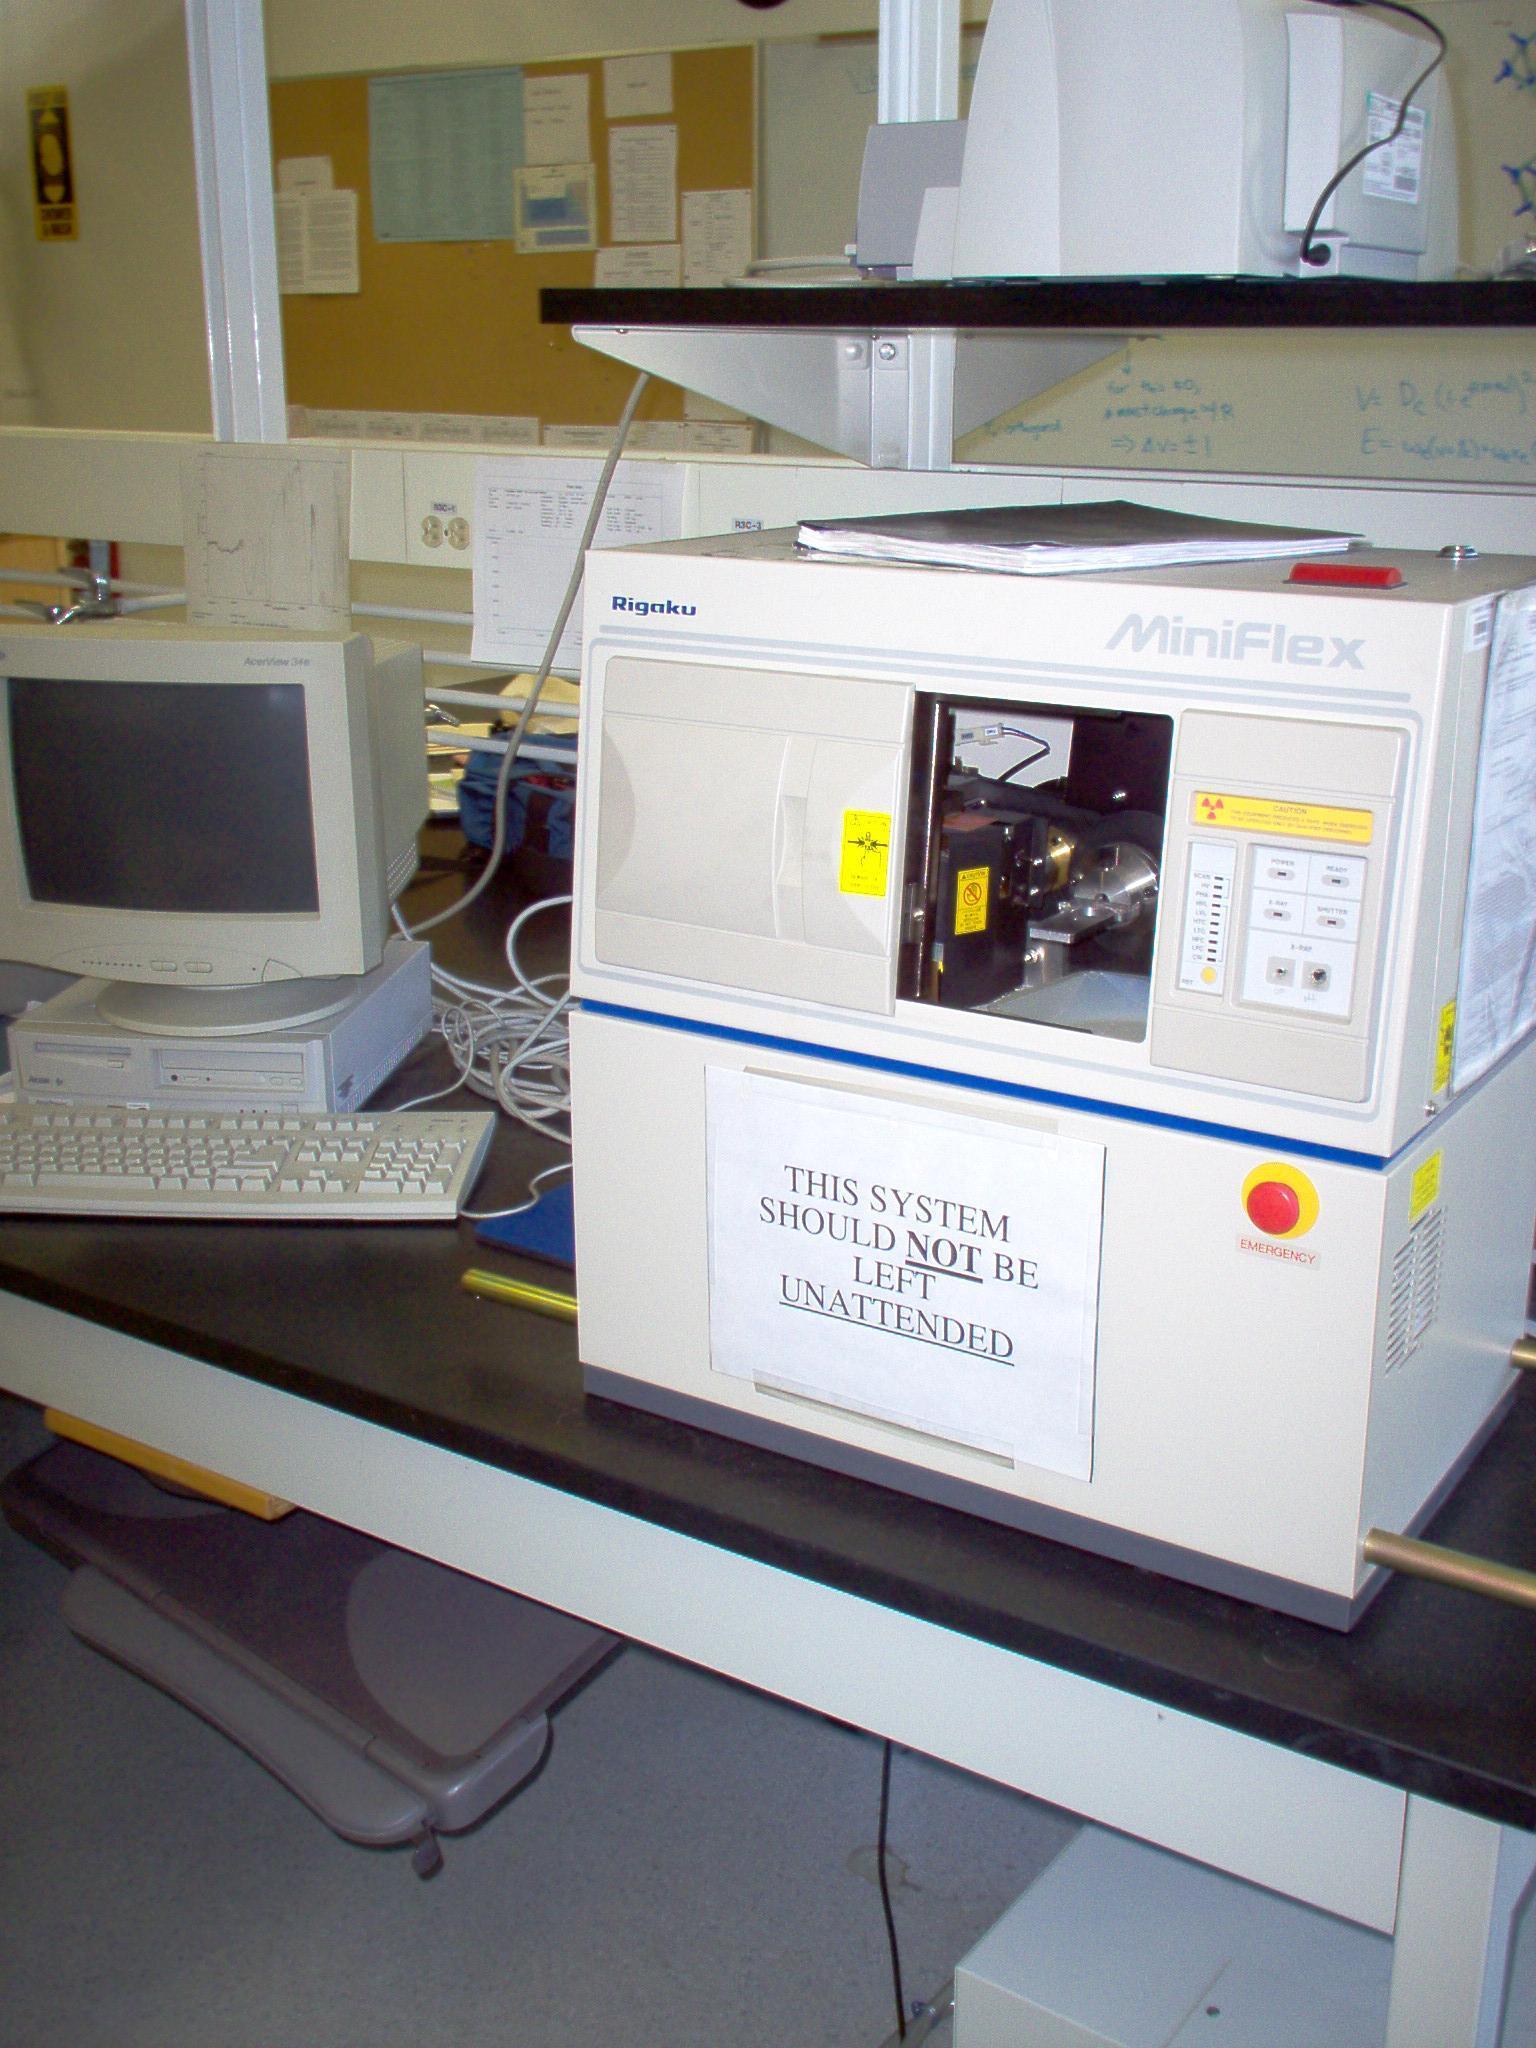
X-Ray Diffraction Lab:
My office hours on Monday April 23rd will be moved to Wednesday April 25th 1-5 pm. You can of course contact me anytime by email or appointment. I also will be available in B77 Hildebrand on Monday 1-5 pm, Apr. 23.
ERRATA: The particle-in-a-box formula has been changed from pre-lab and spreadsheet (now updated) --- orginally it was En=h_bar^2pi^2 / 2*3me*a^2 BUT it is more
accurate to use En=(h_bar^2pi^2 / 2*me*a^2 )*3 -- a factor of 9 difference -- from nx=ny=nz=1.
On Tues. Apr. 17 I will be in Lab from 1:30 -2:15 to give make-up x-ray prelab -- if you need extra help please show up around 2pm and will stay to answer questions.
Hints on KCl -- I will accept analysis of KCl as either FCC, simple cubic or both -- providing you can back it up -- to agree with most literature values you'll need to show how KCl can be FCC. KCl is tricky because it is really a FCC that masks itself as a simple cubic because K+ and Cl- are isoelectronic. Also remember to consider all possible peak differences, not just adjacent ones.
NEW! Here are some quick reference websites you may find useful.
About x-ray production: X-ray 1, X-ray 2
Some short simple sites about PXRD: PXRD 1, PXRD 2
For estimating your crystallite size you are welcome to look up and use the Scherrer equation (you don't have to use the Scherrer equation as it is not really very accurate for our crystallite size). Otherwise just come up with a ballpark estimate from literature about the size of cystallites needed for powder x-ray diffraction.
NEW! To guide you in your analysis I have a .pdf of an Excel spreadsheet I made to analyze the structure of NaCl. It also should guide you on which parameters I am expecting you to find. NaCl example
Urea has tetragonal structure and is challenging (rec. you do it last). Here are a few notes to help you:
There is an error in lab manual formula 4.6 for tetragonal structures. The factor of a^2 in the denominator out-front SHOULD NOT be there.
You really only need to analyze the first 5-6 peaks of your urea data.
"a" and "c" for urea are found by trial and error:
- Set l=0 to start, assume h=k=1 for the first peak and use the correct form of equation 4.6 to solve for "a". Then use the theta values for the first 5-6 peaks to make a table of possible "a" values (you will need to assign h and k values to the other peaks based on the rules you used for KCl/KBr).
- If you calculate similar "a" values from different peaks, you can correctly assume this must be your true "a" value. Calculate your error in "a".
- To find "c" use the correct form of equation 4.6 again, subbing in your newly found "a" value. For each of the first three theta values find possible "c's" for simple Miller indices (e.g. (001), (011), (111), etc). You should find you get a similar "c" value calculated from different theta/Miller indice values. It is safe to assume that this is the correct "c" value.
- Calculate your tetragonal cell volume using V= a^2 * c. Finding Miller indices for urea peaks is not required (just find info about the unit cell from knowledge of a and c).
This is a reminder from pre-lab of a modification to the procedure (also now in instructions by diffractometer). For KCl only you need to do an additional scan from about 55 to 90 to degrees, you will later need this scan to differentiate your KBr and KCl crystal structures.
Here I will post suggestions to help you sucessfully navigate the x-ray diffraction lab. Like most Group III experiments we will introduce new concepts and theory you might not have covered in previous courses. As such you may have to rely heavily on outside resources and the GSI to understand some the key concepts of this lab. Prof. Shank will survey some the basics of x-ray diffraction during the second week of April.
In order to gain a better understanding of Miller indices the following handout may be helpful: Notes
The following are some helpful background documents:
Introduction to X-Ray Powder Diffraction
Some background info on our diffractometer
Crystallography - theoretical introduction
Short intro to crystal structures
Lots of random links and help concerning x-ray induced color or F-centers in halide salts:
Some articles about urea structure:
Fluorescenece Quenching in Gaseous I2 Lab:
I2 Quenching Report Help
Post Experiment Steps (guide to lab manual suggestions):
1) Graph calibration plot.
2) Plot data obtained for 4-5 pressures taken, and fit with a single exponential to determine lifetimes (see lab manual).
3) One way to find the standard error in the time-resolved fluorescence is to linearize the data (w/a natural logarithm). Then use the LINEST function to find the standard error in the slope – then work backwards to find the standard error in k=1/τ -- use these value to place error bars on the points composing your Stern-Volmer plot.
4) Construct a Stern-Volmer plot (hopefully with error bars). If due to experimental error (e.g. large external air leaks) you must rejects points, state this. Show me what you got, you won’t be marked down for a poor linear correlation—just be honest about it. Find the standard error in natural lifetime and α by using the LINEST function (for Excel).
5) Calculate the self-quenching cross-section from your data. Try to compare both your calculated cross-section and natural lifetime to literature values. Do they agree with in standard error? If not, what could be done to improve the results.
Some good extra references: MaQuarrie, Donald, Physical Chemistry a Molecular Approach (try pages 497-500, 511-3, 592-3); also consider Sakuri, K. et al., J. Chem. Phys., 54, 1220(1971); and Brown, Robert, J. Chem. Phys., 41, 10(1064).
Clarification: in pre-lab I quoted the text saying the the primary transition was a ν=0 to 32 transition. This is for a Nd:YAG excitation at 532 nm. However, you worked with a tunable dye laser and used a wavelength closer to 590 nm. Consulting the above references will show that you likely excited a ν=0 to 10 transition at this longer wavelength.
If you want to do error analysis in Excel, I reccommend using the LINEST function. The LINEST function
Oral report suggestions:
Consult the report rubric Fluorescence Quenching of Gaseous I2 (oral)
Prepare a introduction. I am looking for understanding of the data you took and how you took it. Your introduction does not need to be long.
Be prepared to discuss all aspects of the experiment. This will include some theoretical spectroscopy (potential energy, fluorescence, Stokes shifts, selection rules, etc.), some kinetics (pathways for decay of I2*, rate laws, hard sphere model, reason for exponetial dependence, etc.), experimental apparatus (how did we obtain t-resolved measurements, experimental components, etc.), as well as all your plots and calculations.
This experiment is difficult and requires a lot of precision. Be prepared to discuss the errors in your data.
If I ask an unexpected or puzzling question, it generally means I am trying to start a discussion -- I am not expecting an answer, just any response to keep the discussion going. It is possible to receive a high (or even a perfect) and be unable to accurately answer all questions.
Please let me know if you have any questions.
The prelab handout: Notes
HCl/DCl Lab: Summary of the methods of calculating the coefficients (theses are just examples, there are many ways to find them).
(Recently updated parts 4 and 6) Calculating constants help
Please, if you use this sheet go back to the manual afterwards and make sure you know where they come from.
In a pre-lab I may have caused confusion around what you need to plot. To be clear you need to plot the change in wavenumbers as a function of m. But, depending on your analysis you may also need to plot the absolute wavenumbers to find your fundamental frequency.
NEW! To do your graphical error analysis it is a good idea to use the link from the pre-lab hand-out The LINEST function . Just using the R^2 value alone is insufficient and it is a lot of work to do this by hand. Taylor's section on linear regressions will also be helpful. When using the LINEST command be sure to drag out an area in your spreadsheet big enough to accomodate all your statistics.
NEW! If you wish to compare to literature values for the isotopes here is a helpful reference in addition to Herzberg: Guelachivili, G. et al., Infrared Bands of Hcl and DCl by Fourier Transform Spectroscopy, Journal of Molecular Spectroscopy 85, p.271-281(1981). If you wants to get literature values for the 37Cl isotopes use the isotope ratios (equation 6) on the H35Cl/D35Cl literature values.
Make sure you use the peak difference in your plots (nu(m+1)-nu(m))-- as such you will have no points associated with m=-1 or m=0.
Background spectrum: please consider both the intstrument response for your region scanned (consider your IR source), also explain the absence or prescence of any peaks (do you have IR active gases in your spectrometer?)