Addressing curbside demand and management for the loading and unloading of goods and passengers is a perennial planning issue in many major cities across the world. As businesses, residents and workers compete for a limited amount of curbside space, this frequently results in traffic violations as individuals give up on trying to find a legal opportunity to stop their vehicles. Curbside demand and management has become a particular topic of interest among many cities in North America as movements towards promoting density in urban cores and the proliferation of same-day delivery and TNCs such as Uber and Lyft have created new pressure on curbside space. Cities such as Seattle and Washington, D.C. have developed city-wide curbside demand and management strategies that work to balance goods movement and right-of-way access for multiple modes. San Francisco, with its dense core and constrained geography, is no exception to the previously identified trend of increased pressure on curbside demand and management.
To approach the subject of curbside demand and management as it relates to passenger and commercial loading, it is important to understand the nature of demand placed on curbside loading space in San Francisco. Policies related to curbside demand and management have approached the problem in relationship to time and location of increased demand as well as adjacent land uses that potentially trigger demand for curbside loading. Research conducted by the SF Planning Department on urban freight movement in San Francisco found that conflict over freight movement is most often linked to a lack of adequate space, design issues, vehicle size and loading during peak periods. This frequently manifests as vehicles blocking the travel lane and bicycle facilities. To approach this problem, double parking violations in San Francisco is analyzed as a proxy for curbside demand (and potentially the failed management of curbside space). The location, time and adjacent land uses are examined to better understand what variables might be associated with curbside demand for future policy decisions.
Data
To do this analysis, double parking violations issued by San Francisco’s Parking Control Officers from January 2014 to August 2016 were first acquired. PCOs are the primary entity that enforce double parking violations in San Francisco. This data included the approximate location and time of the violation. As the data does not include a description of the type of vehicle, it is not possible to ascertain whether or not a record represents a commercial or personal vehicle committing a violation. While this certainly limits the ability to make conclusions about certain types of curbside demand, it is still useful to explore passenger and commercial loading demand as a general category. This data was first cleaned in Python to drop records with missing information as well as standardize the addresses for further processing. The approximate addresses given by PCO officers in the records were then geocoded using Nomanatim/Google API services. To do the geocoding, code based off Geoff Boeing’s work was adapted. This resulted in 65,780 geocoded violations. Land use, neighborhood, development pipeline and Census block information was acquired from SF Open Data. Finally, data on job and household numbers by Census tract was provided through the 2010 baseline data for MTC’s land use model.
Geographic Distribution
To begin the analysis, the data was first geocoded and uploaded to CartoDB to get an understanding of the geographic distribution of violations within San Francisco. The following map shows the intensity of double parking violations across San Francisco from this dataset.
Figure 1: Double Parking Violations across San Francisco
This map shows clear clusters of double parking intensity, including in the eastern neighborhoods of San Francisco. While this is useful to get a sense of the distribution of the data across the entire city, it is not possible to make claims on certain neighborhoods with this tool. As many planning programs in San Francisco operate on the neighborhood scale, it is useful to see the data reported at that level. To see distributions by neighborhood, violations were coded with neighborhood information in GeoPANDAS. This was done by joining the violations to a shapefile that contained Census tract and neighborhood information. This produced a data frame that included neighborhood and Census tract information for every violation. It was then possible to do a count by neighborhood and produce the following figure with Altair’s data visualization packages.
Figure 2: Violations by SF Neighborhood
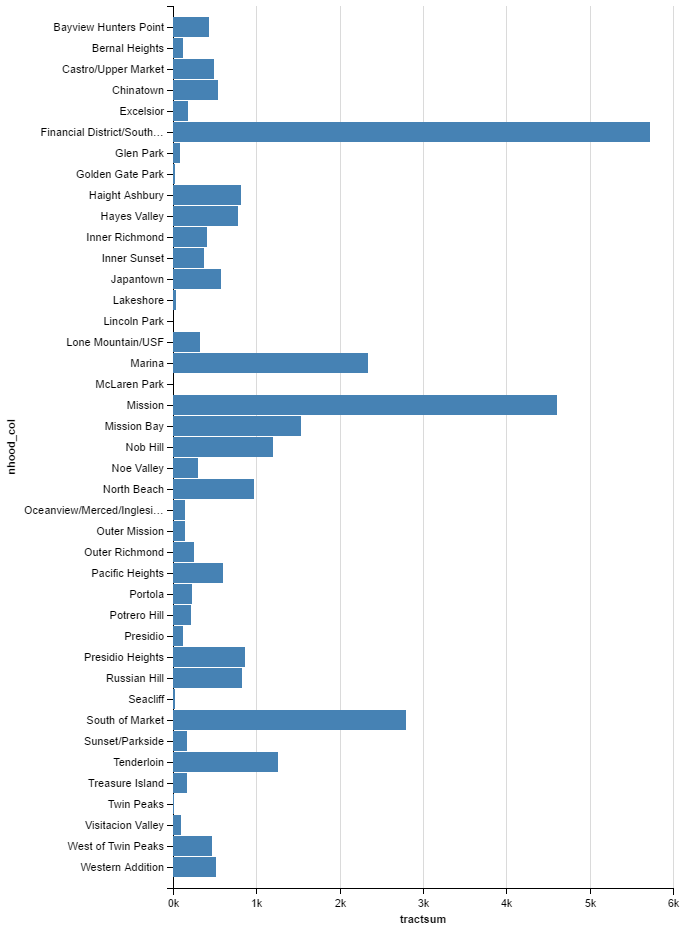
The top five neighborhoods for double parking in San Francisco were the Financial District/South Beach (9,892 violations), the Mission (9,285 violations), South of Market (5,725 violations), the Marina (5,309 violations) and the Tenderloin (4,205 violations). The less densely populated southwestern section of San Francisco contained the neighborhoods with the fewest double parking violations. The results might be expected by San Francisco residents due to the density of residents and businesses in the eastern neighborhoods of the city.
Finally, the violations were looked at in terms of the approximate address given by PCO officers. Many of the addresses contained multiple violations, signaling particular intensity at specific locations scattered throughout the city. To understand this better, violations were counted by address and then exported to a data frame. The data was filtered to contain the top 200 addresses in terms of number of double parking violations. These addresses and the number of violations were then put into a GeoJSON file which was then mapped using Leaflet. The results are below.
Figure 3: Top 200 Addresses by Double Parking Violations
Legend:
- Yellow Circle: Bottom 25 percentile within top 200 addresses
- Orange Circle: 25 – 75 percentile within top 200 addresses
- Red Circle: 75 + percentile within top 200 addresses
As Figure 3 shows, many sites of repeated double parking violations are clustered together. The cluster of violations at the corner of Mission Street and Van Ness Avenue provides one such example. While some of the addresses here seem to be rather isolated (e.g. the locations in the Richmond District), they generally follow the same clustering as demonstrated in the Figure 1.
Date and Time
Strategies to address curbside demand and management often involve using time restrictions to increase the supply of curbside parking and loading through increased turnover. This includes restricting the overall time of a vehicle to stop in a loading space, but this can also include transitioning curbside space from metered parking to loading depending on the day of the week and time. To better understand if time restrictions on curb space might improve street conditions, double parking violations were analyzed in terms of the issue time and date. To achieve this, data was cleaned using Python’s built in functionality to parse time and dates. This allowed all of the data to be coded by the day of the week as well as time data to be legible for analysis. Code adapted from Geoff Boeing’s work was used for this data visualization.
Figure 4: Violations by Day of the Week
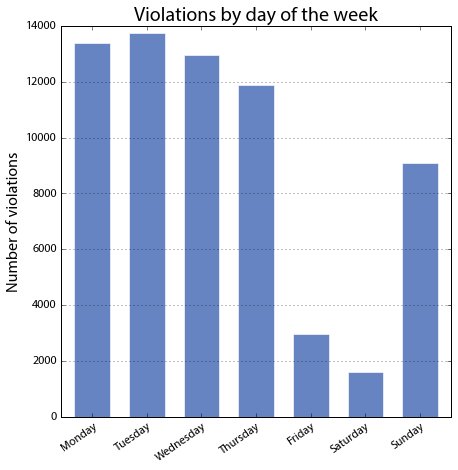
Violations peaked generally at the beginning of the workweek. Tuesday experienced the most double parking violations at 13,778 violations while Saturday experienced the least at 1,619 violations. Interestingly, Sunday experienced a high frequency of double parking violations at 9,113 violations.
Figure 5: Violations by Date (All Data)
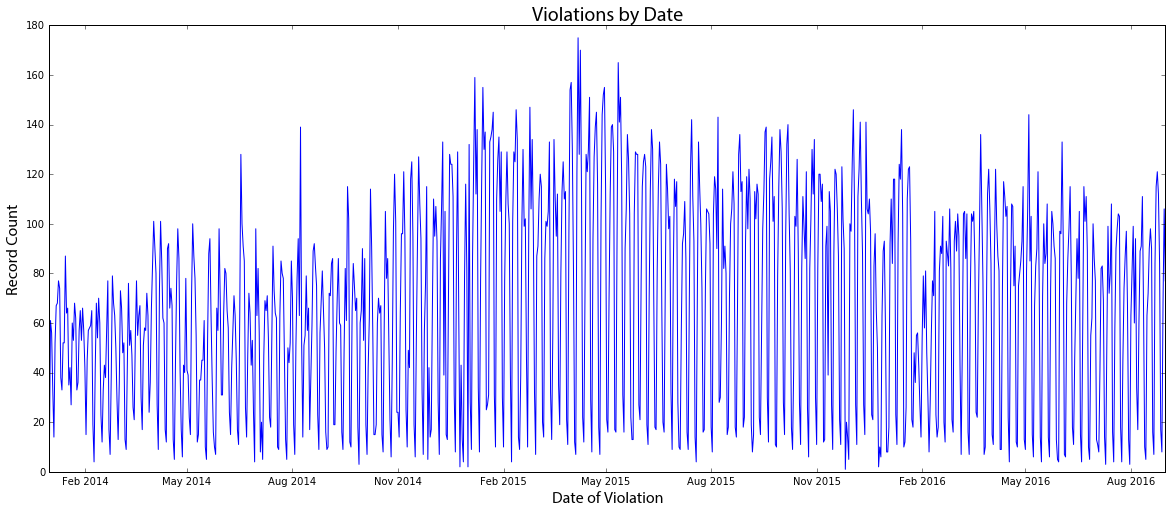
Figure 6: Violations by Date (Q2 2015)
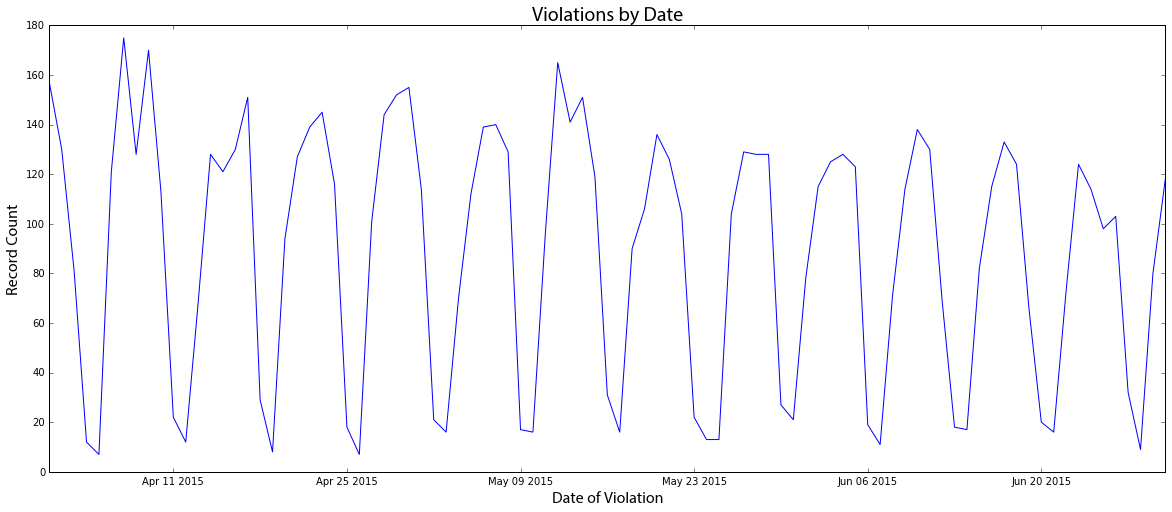
To see general trends over time in the dataset, date information was plotted by frequency of double parking violation records. Figure 5 shows this for the entire data set, and Figure 6 shows this for the second quarter of 2015. For the entire data set, records are fairly consistent with the exception of a spike of double violations in May of 2015 and a drop in February of 2016. As the detail is hard to read in the initial visualization, I separated out one quarter for further analysis. The pattern of violations generally matches the previously described trends related to the days of the week. Intensity of double parking violations tends to be higher at the beginning of the workweek and falls at the end of the workweek and weekend.
Figure 7: Violations by Time of Day
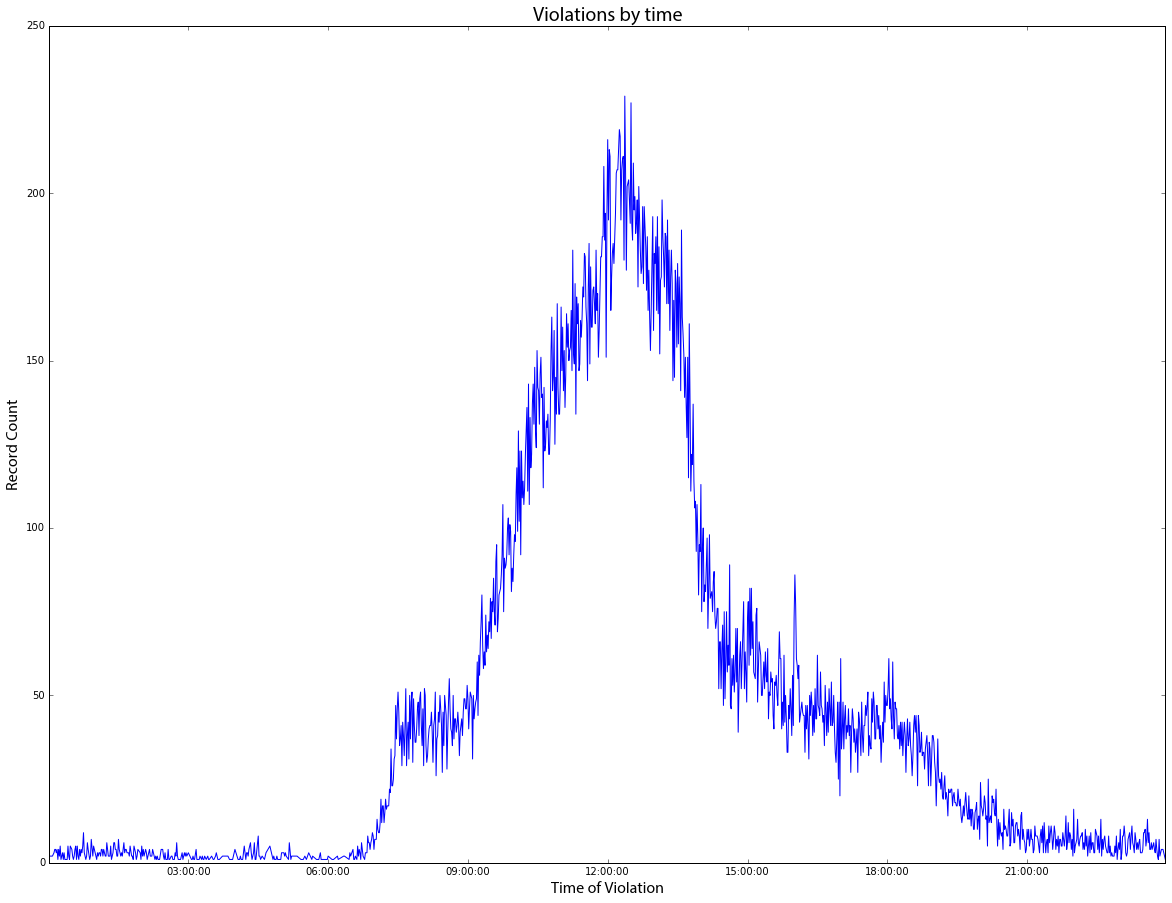
Finally, violations were examined by the time of the day provided on the record. Records were counted by the time of the violation and then graphed. As Figure 7 shows, violations are highly peaked, with most violations occurring around noon. This is surprising as the data does not peak at the morning or afternoon rush hour periods, but rather in the middle of the day.
Land Use
Finally, the data was analyzed in relationship to land use and other factors that might drive loading demand. Zoning information was incorporated using spatial data obtained from San Francisco’s open data portal and joined with double parking violations. These were looked at in terms of general land use categories and specific zoning use district designations across the city.
Figure 8: Violations by General Land Use Category
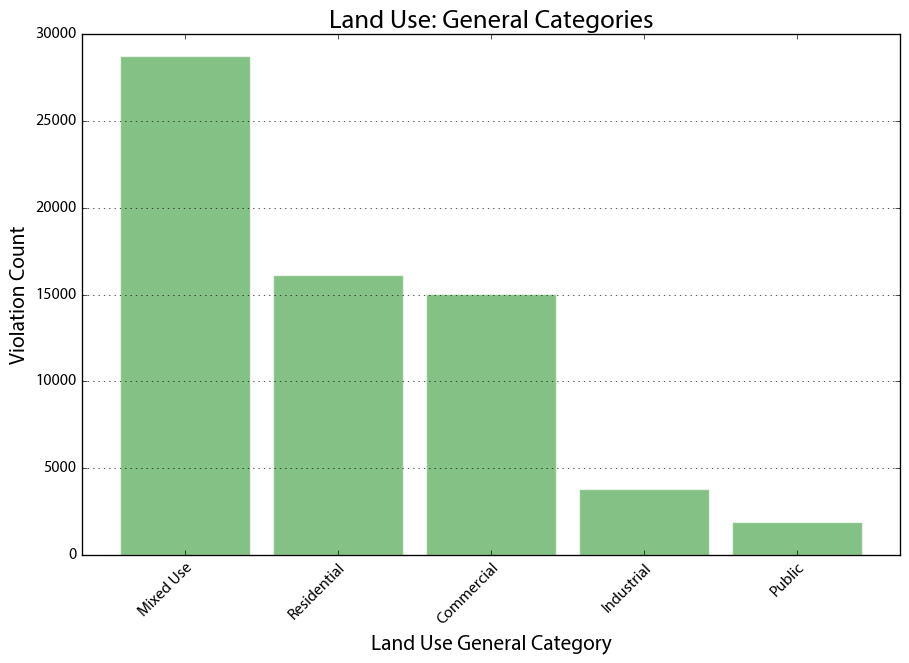
Figure 9: Violations by Zoning Use District
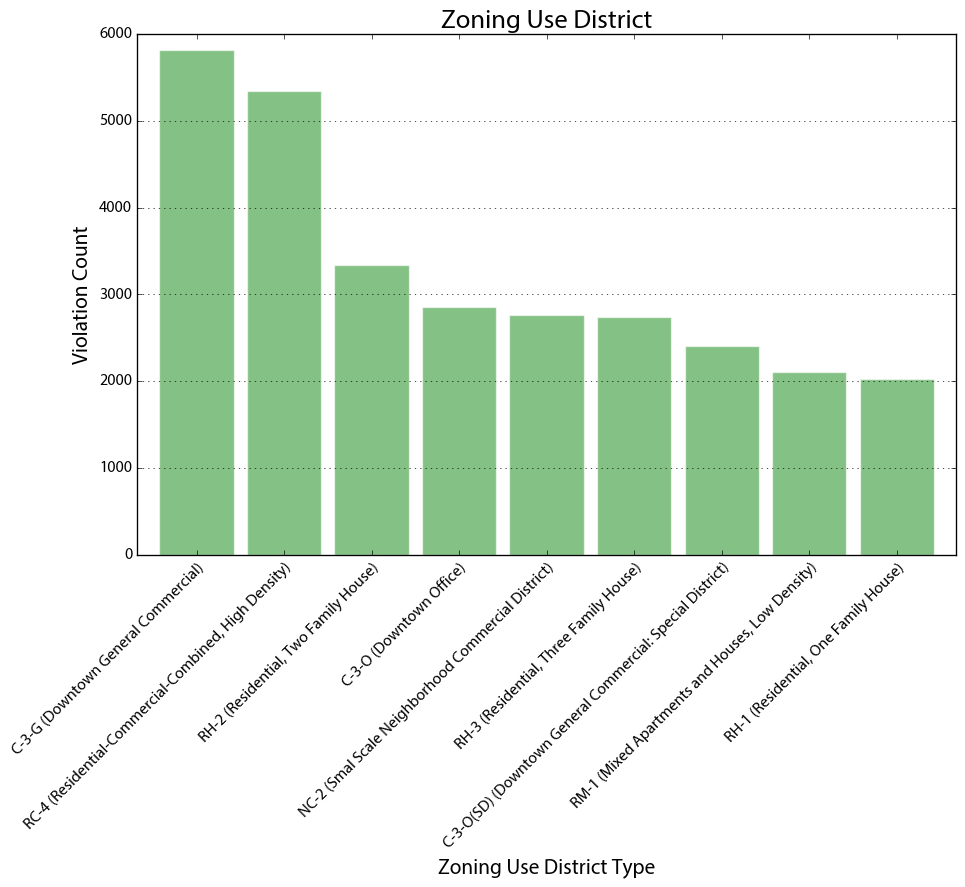
Double parking occurred primarily in mixed-use and residential areas of the city in terms of general land use categories. For the top zoning use districts represented in the data, Downtown districts were well represented. This does not come as a surprise considering the earlier findings regarding geographic distribution of the double parking data. Interestingly, residential districts are also well represented in terms of both general land use and zoning use districts. For zoning use districts, this includes districts characterized by mostly low density, single family homes. As curbside demand and management policy and regulation is often focused on commercial districts, this shows that residential districts must also be considered within a city-wide approach to curbside demand and management.
The findings from the previous analysis showed an interesting relationship between different types of land use and double parking violations. To explore this in more depth, double parking violations were examined in terms of their correlation with proxies for residential and commercial land use through a regression model. To do this, violations were first aggregated to the Census tract level. Independent variables for the model were created from the 2010 baseline data for Plan Bay Area. This resulted in a data set with total double parking violations, square footage for residential buildings, square footage for nonresidential buildings, development pipeline projects and households. These were all divided by the area of the Census tracts to normalize the inputs for the model.
Figure 10: Regression Results for Double Parking Violations per Square Mile
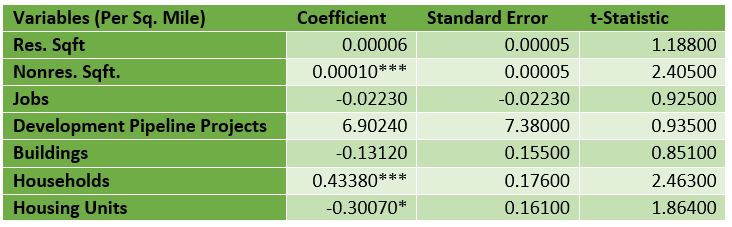
The strongest positive correlation for double parking violations was development intensity (development projects in the pipeline per square mile). Number of households also showed a strong positive correlation and were statistically significant at the 99% confidence level. As the results are in different scales, it is hard to compare between results. One clear takeaway is that, again, residential development as well as residential density is positively correlated with double parking violations. To help visualize these results, a map was also created that allows the user to select certain variables within Census tracts and see clusters of intensity.
Figure 11: Double Parking Violations and Selected Variables by Census Tract
Clicking on the widgets at the bottom of the map allows the user to see how different variables are related. The map loads with the higher percentile tracts of violations and household density to show how these variables cluster in certain parts of the city. Clicking through the relationships helps visualize how these variables interact across the city.
Conclusion
Double parking in San Francisco occurs unevenly across the city in terms of both time and geography. Due to this, strategies to address curbside demand must focus on time restrictions in areas of the city with intense demand such as the Financial District and Mission. Precedents such as New York City’s time restrictions on loading in midtown Manhattan provide possible approaches to help mitigate loading demand. While the violations show that the workweek is predictably the most intense time for curbside demand, Sunday is also a time of increased demand on curbside space. As such, policies and approaches to this issue should not be restricted to the workweek.
In terms of land use, Downtown San Francisco commercial districts were predictably areas that demonstrated high intensity of double parking violations. As such, policies that address curbside demand and management must consider the unique strains on curbside space in this part of the city. The data also shows, however, intensity in residential sections of San Francisco. Policies regarding curbside loading in San Francisco are often focused on commercial districts and developments. To help improve the flow of traffic on San Francisco streets, policies must also address residential sections of the city that also experience intense curbside demand.