Business Data — business.json
To begin with my analysis, an important first step was to look at the data provided. The Yelp Dataset provided six JSON files; we begin with the business.json file to get a sense of the businesses that we are working with.
businesses = pd.read_json('../input/business.json', lines=True)
businesses.groupby('city').count().sort_values('state', ascending=False)['state'].head(20)

city
Las Vegas          29370
Toronto            18906
Phoenix            18766
...
Henderson           4892
Tempe               4550
Chandler            4309
Cleveland           3605
...
North Las Vegas     1548
Name: state, dtype: int64
Out of all of the cities represented in this dataset, Las Vegas, Nevada appears to have the most businesses in our data. We also see that surrounding cities of Las Vegas, such as Henderson and North Las Vegas, are also represented. It seems like the Las Vegas Metro would be a good choice for our data analysis, since it would allow us to have the largest sample size of businesses for our later analysis.
Data Cleaning
Based on the data, I decided to primarily focus on Las Vegas and surrounding cities for my analysis. Using Google maps, I was able to define latitude and longitude boundaries for the area that I was interested in, and then filter our businesses to only include those that lay within this polygon boundary.

def in_vegas(x, y):
    """Whether a longitude-latitude (x, y) pair is in Las Vegas polygon boundaries.
    ADAPTED FROM http://alienryderflex.com/polygon/"""

    j = len(polygon.index) - 1
    lon = polygon['lon'].values # lon = x
    lat = polygon['lat'].values # lat = y
    odd_nodes = False
    for i in range(j + 1):
        if (lat[i] < y and lat[j] >= y) or (lat[j] < y and lat[i] >= y):
            if (lon[i] + (y - lat[i]) / (lat[j] - lat[i]) * (lon[j] - lon[i]) < x):
                odd_nodes = not odd_nodes
        j = i
    return odd_nodes

vegas = businesses
vegas['in'] = vegas.apply(lambda row : in_vegas(row['longitude'], row['latitude']), axis=1) & \
    vegas.apply(lambda row : in_vegas(row['longitude'], row['latitude']), axis=1)
vegas = vegas[vegas['in'] == True].drop(columns=['in'])
Plotting our new data to ensure that we have filtered correctly, we get a very familiar picture of the Las Vegas area.

The above graph includes 35,787 businesses in the Las Vegas area, but 21,579 of these businesses have less than 20 reviews. In order to maximize the accuracy of the star ratings for businesses, I then filtered out to only include businesses that have 20 or more reviews on Yelp, resulting in a much more pruned image of Las Vegas.
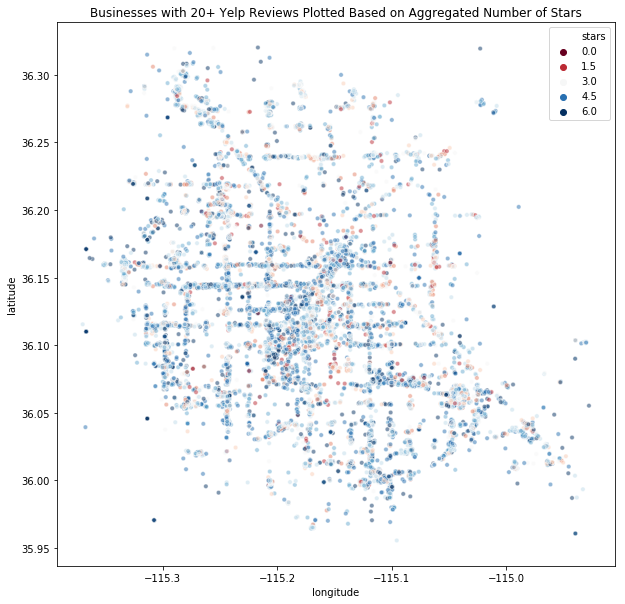
The above graphs were generated using a Python plotting library, Seaborn, and they both have some interesting implications. In the above graph, we see that there are areas and clusters of businesses adjacent to one another that have very different ratings. Confirming our intuition, we also see a larger number of Yelp businesses along and around “The Strip” and downtown areas, which have become the inner core of Las Vegas.
Exploring the Business Data
Using this Carto map, I was able to explore the data more interactively and investigate further the so called “star divide” that was occurring near The Strip. Looking in the Paradise, Nevada region, we see where the difference is most prevalent. We see a large cluster of businesses with average ratings in the 3 to 5 star range, and right down the street from this area, there are clusters of businesses with marginal ratings — less than 2 stars on average. The Strip is a high-tourist area; the city of Las Vegas draws in close to 40 million annual visitors, with The Strip being the largest attraction for tourists. Thus, we have a high-tourist area with generally good reviews, and directly adjacent to this area is a community with generally bad reviews. Could the high tourism be affecting the reviews for businesses? Or rather, is the high tourism affecting regions around The Strip; if resources and money is being funneled into one region, are the surrounding communities left to fend for themselves? These are questions about regions and communities, and our Yelp data relies on information from the individual. Thus, we had to look elsewhere for community data: Census Data.
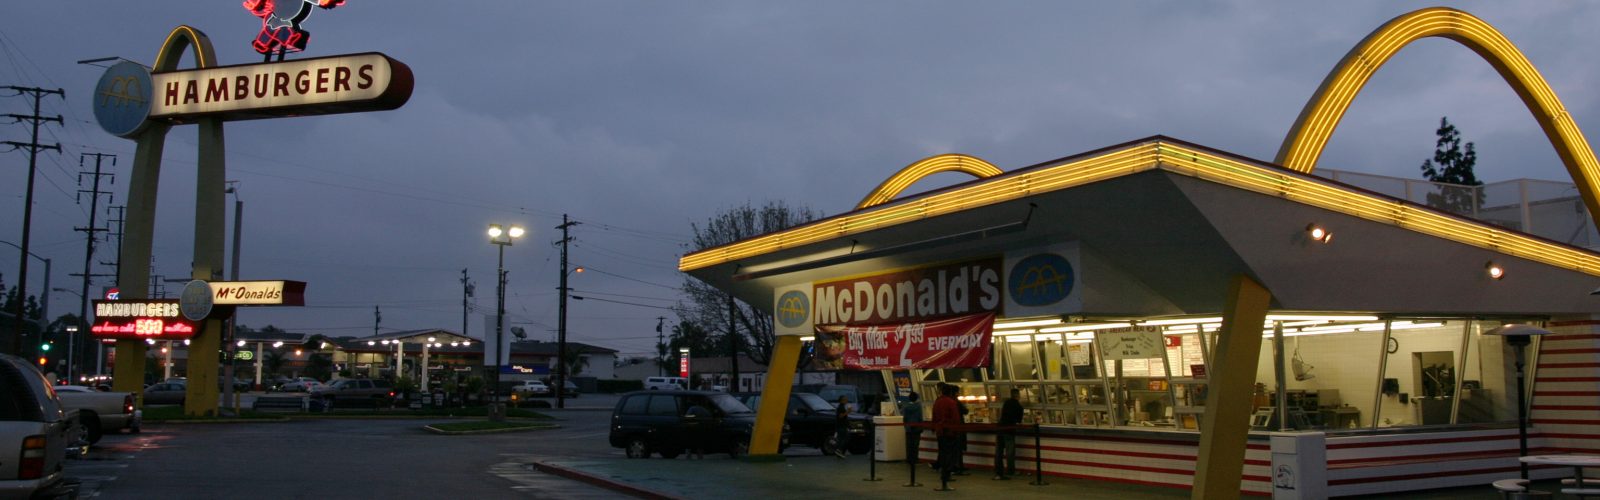
Social Explorer is an online service that provides detailed U.S. Census Data, supplemented with an interactive map. This form of geospatial data was perfect for our purposes, and would allow us to explore the deeper divides that lay within this community. Due to some of the limitations of the service, I chose to focus on one business to remain constant throughout the analysis: McDonald’s.
The choice of McDonald’s was somewhat arbitrary, but had a few foundational aspects that allowed for greater analysis. The business is very common across the U.S., and my limited knowledge of this specific geographic region swayed me in the direction of a business that was common in most areas of the country. Further, I inferred that McDonald’s is also regularly visited by locals residents as well as visitors, and thus we would be getting an aggregated review of the business. With this, I also realized that this business had the best chance of having the most review data, since it is such a common restaurant. Filtering the McDonald’s locations out, we again plot all businesses in Las Vegas, but with the locations of McDonald’s highlighted.
mcdonalds = vegas[vegas['name'] == 'McDonald\'s'].sort_values('stars', ascending=False)
plt.figure(figsize=(10, 10))
sns.scatterplot(x='longitude', y='latitude', data=vegas, palette='Blues', s=10, alpha=0.5)
sns.scatterplot(x='longitude', y='latitude', hue='stars', data=mcdonalds, palette='Reds_r', s=90)
plt.title('McDonald\'s Locations in Las Vegas, NV from Yelp Reviews')
plt.legend(title='Yelp Rating for McDonald\'s Locations', loc=1);
These locations were exported to a CSV file for mapping on Social Explorer. Utilizing the Census Data available on Social Explorer, I chose to look at the Median Family Income for a Census Block Group from the 2017 American Community Survey 5-Year Estimates in relation to the locations of McDonald’s across Las Vegas.
Using this map as resource to spatially understand the demographics of the region, I was able to locate the same areas where we see divides between businesses around the Paradise, Nevada region, near The Strip. But to further our understanding of these businesses, we needed to look at the data at the user’s level: review analysis.