Earthquake Maps
-This project was completed for Exercise 10: Python Mapping-
Overview
I made the maps in this post using the GeoPandas and matplotlib libraries for python. I used location data from all M 4.5 and greater earthquakes from the past month from the USGS.
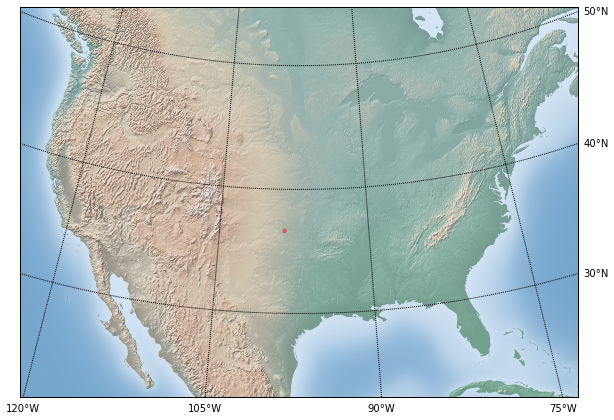
1. Local US Earthquake Map
As the my focus of my final project will be on California, I wanted to first create a map of the earthquakes in CA. This map, however, appeared to be empty so I plotted a map of the whole country, which appeared blank. I realized–after plotting the ortho-map in the second section–that there was only one large earthquake in the US in the past month, and the small size and low transparency of the marker made one event hard to see (located about 35 N, 100 W). This map was made using an Albers projection and WGS 84
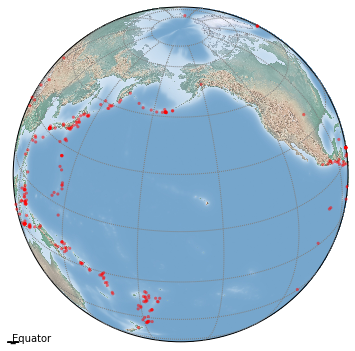
2. Ring of Fire Map
The next map I made was to test to see if my data were being plotted, so I moved the map to an area I knew would have large earthquake events: the Pacific Ring of Fire, where 80% of the world’s large earthquakes occur. This proved to be more fruitful, and actually led me to notice that there was an event in the central US. This map was made using an orthographic projection and WGS 84.
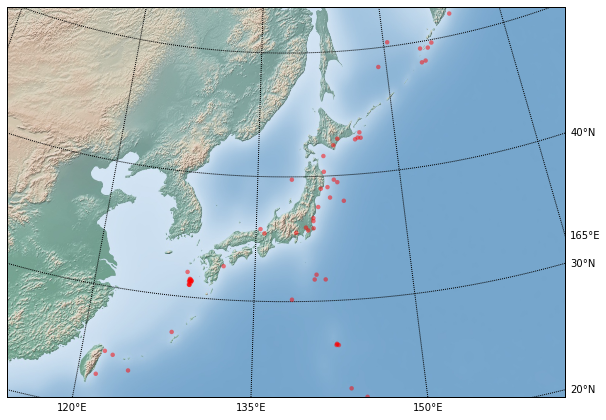
3. Local Japan Earthquake Map
Zooming in on Japan–a much more interesting area this past month–I used the same type of plot as in the first map, but showed an area with a greater number of events. Using the same Albers equal -area conic projection works for comparing the United States with Japan, because both have most of their land area between 30 N and 40 N.