
The last posts have interrogated the linkages what is and what is not accessible via public transit in metropolitan areas. But what is your local bus or train is out of commission, or simply unreliable? Whether it’s because Bay Area Rapid Transit (BART) is truly as terrible as some think, Californians will regardless rely heavily on their cars to get around; as of two years ago, a study found that annual driving per-capita is 150% higher in California than the rest of the United States.
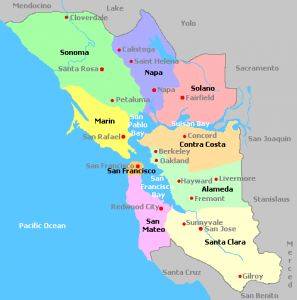
The San Francisco Bay Area
The Bay Area is a large tract composed of nine counties. Although the Bay is often lumped into one geographic zone, the characteristics of each county vary heavily.
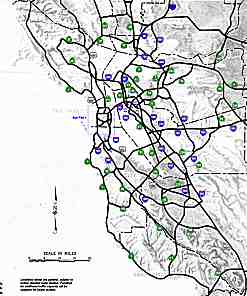
The concentration of drivable roads varies. Below is a map of the Bay Area’s driving networks. As you can see, there is disparate concentration of drivable networks– specifically in Contra Costa, Alameda, and Santa Clara Counties.
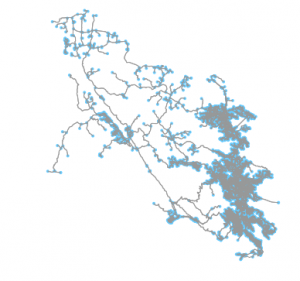
The darker the space on the map, the denser the concentration of driving networks. The concentration of streets is also indicative of were people are likely working and commuting.
Understanding Commute Choices
To parse this question, it is helpful to look at the Bay Area through a different lens: Traffic Analysis Zones (TAZ). TAZ are constructed by census block information; typically, they capture important information like the number of cars per household, income, and employment within each zone. However, with nearly 4000 TAZ in the Bay Area, the analysis quickly becomes confusing.
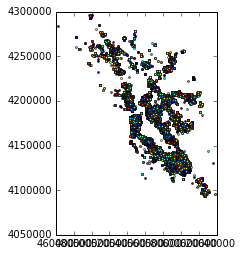
For this reason, it’s easier to understand the geographic make-up using a different classification called “super districts.”
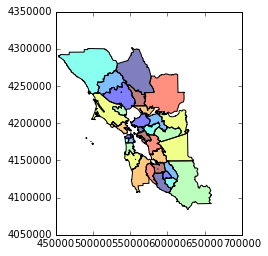
This vantage point becomes clearer when looking at the super districts. The smaller districts are often more densely populated and have quite a bit of flow in between them every day. The Bay Area has attempted to account for the mass amount of commuting with an intricate and vast road network.
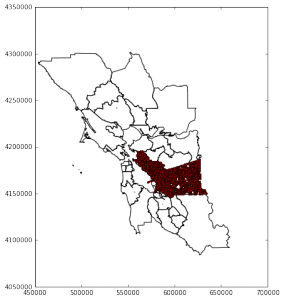
However, density and accessibility may not be the issue. A map of just Alameda’s drivable network shows that roads and drivable options are not in short supply; in fact, the availability of roads may be encouraging more people to drive rather than use public transit or alternative methods because driving is essentially easier, and cheaper. As a measure of basic supply and demand, the more roads that are available, the cheaper driving becomes.
Challenging the “More Supply, More Demand” Theory
But let’s pretend for a moment that the Bay Area functions as some sort of economic Upside-Down; what is the robustness of roads isn’t explaining the heavy reliance on cars and subsequent traffic?
If it’s true then that the availability of roads is the causing traffic, we also have to probe what public transit looks like. BART stations are located throughout the central part of the Bay Area: in Alameda, Contra Costa, and San Francisco Counties.
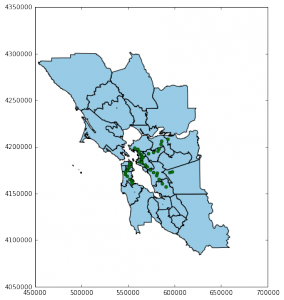
Vital Signs, the brain child of the Metropolitan Transportation Commission put together a basic breakdown of commute patterns in the Bay Area: they found that a majority of commuters from each one of these counties is traveling to one of the other three for work. So the supply is there, but where is the demand?
Using a buffer of about 60 miles, we can see that BART stations are accessible even outside of of their designated counties if people drove to the stations and parked their cars. However, only about 16% of commuters are using BART to commute to work (more often that not going to and from SF, Alameda, and Contra Costa Counties).
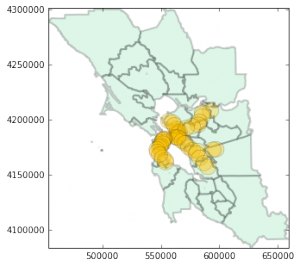
So the supply for BART, while it could certainly be better, is there- but the demand is not matching up.
Conversely, the supply for roads may not be as formidable as one might hope. Although the Bay Area has a wealth of roads, many of them are not so easily navigable. Pulling coordinates from the center of San Francisco show you the number of roads that lead to dead ends; many of which are only one way streets.
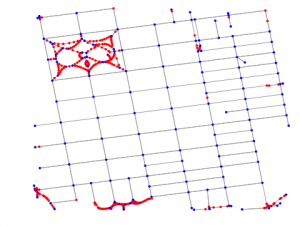
Highlighted in red, you see roads that are characterized as “endpoints” and have no outlet. While the supply may be there, quality of driving in San Francisco leaves little to be desired.