Link to a list of papers on dissociative disorder.
| Note: Kihlstrom, Glisky, & Angiulo (1994) provided a comparative discussion of several scales introduced to measure dissociative tendencies in clinical and nonclinical populations. That paper made reference to a further manuscript in preparation by Angiulo and Kihlstrom (1993). Owing to Angiulo's untimely death (March 10, 1995, at the age of 43), this paper was never published. What follows is the 1993 draft of this paper, updated as appropriate. |
A total of 1,463 subjects completed the Dissociative Experience Scale (DES) and the Questionnaire of Experiences of Dissociation (QED), two instruments intended to assess dissociative tendencies, and the Tellegen Absorption Scale (TAS). The three scales were highly intercorrelated, and the DES and QED appeared to be almost interchangeable. Separate principal-components analyses showed all three scales to be multidimensional, and revealed a strong component of absorption and imaginative involvement in the DES.
The recent escalation of interest in post-traumatic stress disorder (PTSD), multiple personality disorder (MPD), and other forms of dissociative syndromes has led to the development of a number of instruments intended to screen the population for individuals who already suffer from these illnesses, or who may be predisposed to develop them in the future. Although a number of questionnaires, such as the Tellegen Absorption Scale (TAS: Tellegen & Atkinson, 1974) have items reflecting experiences of dissociation and depersonalization, the first instruments expressly designed to assess dissociative tendencies were the Dissociative Experiences Questionnaire (DES) of Bernstein and Putnam (1986; Carlson & Putnam, 1988) and the Perceptual Alterations Scale (PAS) of Sanders (1986). Somewhat later, Riley (1988) introduced the Questionnaire of Experiences of Dissociation (QED), as an alternative to the DES. These self-administered questionnaires, intended for screening purposes and psychometric studies, have been supplemented by two clinician-administered structured clinical interviews, the Dissociative Disorders Interview Schedule (DDIS; Ross, Heber, Norton, Anderson, Anderson, & Barchet, 1989) and the Structured Clinical Interview for DSM-III-R Dissociative Disorders (SCID-D; Steinberg, Rounsaville, & Cicchetti, 1990). The DDIS and SCID-D both yield diagnoses of the various dissociative disorders, which are not included in the other structured interviews such as the Schedule for Affective Disorders and Schizophrenia (SADS; Endicott & Spitzer, 1978), the NIMH Diagnostic Interview Schedule (DIS; Robins, Helzer, Croughan, et al., 1981), or the standard version of the Structured Clinical Interview for DSM-III-R (SCID; Spitzer, Williams, Gibbon, & First, 1990).
Both the DES and the QED have been shown to discriminate between MPD and other conditions (Bernstein & Putnam, 1986; Frischholz, Braun, Sachs, Hopkins, Schaeffer, Lewis, Leavitt, Pasquotto, & Schwartz, 1990; Riley, 1988; Ross, Norton, & Anderson, 1988; Steinberg et al. 1991), whether these are clinically diagnosed or assessed through structured interviews. However, little is known about the distribution of DES and QED scores in the population at large, the internal structure of the scales, the relations between them, or their comparative validity in identifying individuals with (or prone to) dissociative psychopathology. In the following paper, we report a large-scale analysis of DES and QED, providing norms as well as analyses of both the internal structure of these scales and the relations between them, based on a large sample of the college-student population.
A total of 1,463 college students, approximately 41% male and 59% female, enrolled in an introductory psychology course took part in a survey session at the beginning of the semester. In return for their voluntary participation, the subjects received credit toward the research participation component of their course.
During the survey session, the subjects completed a packet of personality questionnaires. The first of these consisted of the 28-item Dissociative Experiences Questionnaire (DES; Bernstein & Putnam, 1986), the 26-item Questionnaire of Experiences of Dissociation (QED; Riley, 1988), and the 34-item Tellegen Absorption Scale (TAS; Tellegen & Atkinson, 1974). Items from the three scales were interleaved.
In their original versions, the three scales employ different response formats. The DES relies on 10-cm visual analogue scales, scored to the nearest 5 cm, and items worded in the second person (see below); the QED and TAS employ the usual first-person, dichotomous true-false format; finally, all the items of the DES and TAS are worded positively, while the QED contains several reversed items to counteract acquiescence tendency on the part of the subjects. For comparative purposes, we put the three instruments in a common format and collect responses on a common scale.
The use of visual analogue scales was deemed inappropriate for a large-scale survey, on the grounds of the sheer labor involved in scoring 88 items in this manner from more than 1,000 subjects. Moreover, we realized that a 10-cm visual analogue scale, scored to the nearest .5 cm, is essentially a 21-point Likert-type scale. As Nunnally (1978) has noted, the reliability of Likert-type scales levels off between 7 and 11 steps. Accordingly, for each item on the questionnaire we presented subjects with a 0-100 scale, divided into 11 segments (thus forming an 11-point Likert-type scale), and asked subjects to indicate "approximately the percentage of time each experience happens to you". Carlson (personal communcation, November 15, 1991) has recently revised the DES along similar lines. Summing ratings across items, the possible raw scores ranged from 0 to 2800 for DES, 0-2600 for QED, and 0-3400 for TAS.
In current practice, scores on the DES are reported in terms of the average percentage rating given to each item. For example, if a subject reported at each experience sampled by the DES occurred 50% of the time, he or she would receive a score of 50. These percentage scores may be calculated by dividing the total DES score by 28, yielding a scale of 0-100. However, the QED and TAS are scored more conventionally, in terms of the number of items endorsed by subjects (or, where Likert-type scales are used instead of dichotomous scale, the total of the ratings given to each item). For example, if a subject endorsed 50% of the items of the DES, he or she would receive an item score of 14 (if the scale were dichotomously scored) or 1400 (using the 0-100 scoring scheme represented by the present 11-point Likert-type scale). The two scores are, of course mathematically equivalent: the percentage score may be obtained by dividing the item score by 28. In order to put the three scales on a common dimension, norms for the DES, QED, and TAS are reported below in terms of percentage scores, varying from 0-100.
In addition, the DES items were reworded in the first person. For example, Item #1 of the original DES reads: "Some people have the experience of driving a car and suddenly realizing that they don't remember what has happened during all or part of the trip. Mark the line to show what percentage of the time this happens to you." This item was reworded as follows: "Sometimes I have been driving a car and suddenly realized that I didn't remember what had happened during all or part of the trip." The negatively worded QED items were reworded in a positive direction. For example, Item #7 of the original QED reads: "I rarely feel confused, like in a daze." This item was reworded as follows" "I sometimes feel confused, like in a daze."
As with any survey of this nature, some subjects failed to complete every item on the questionnaire. Of the 1,463 subjects, 1,367 provided complete scores on DES, 1,335 on QED, and 1,308 on TAS.
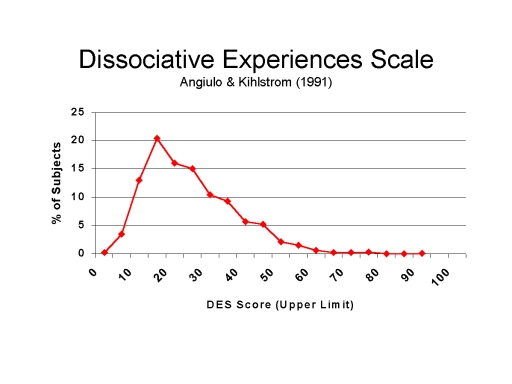 The mean percentage score for DES was 22.40 (SD = 12.73), with a
median of 20.36. Figure 1A shows the frequency distribution of scores, which is
sharply skewed toward the low end of the continuum. Percentage scores equivalent
to salient decile cutpoints were: 80th percentile, 32.50; 90th percentile,
40.36; 95th percentile, 45.00; and 99th percentile, 57.32. The reliability of
the DES, estimated by Carmine's theta, was .92.
The mean percentage score for DES was 22.40 (SD = 12.73), with a
median of 20.36. Figure 1A shows the frequency distribution of scores, which is
sharply skewed toward the low end of the continuum. Percentage scores equivalent
to salient decile cutpoints were: 80th percentile, 32.50; 90th percentile,
40.36; 95th percentile, 45.00; and 99th percentile, 57.32. The reliability of
the DES, estimated by Carmine's theta, was .92.
Figure 1.
Frequency distributions of scores on the Dissociative Experiences Scale (DES; Panel A)
and the Questionnaire of Experiences of Dissociation (QED; Panel B).
An exploratory principal-components analysis yielded five factors accounting for 48.85% of the variance (see Table 1). These factors were subjected to orthogonal rotation by the varimax method.
| Factor 1 included items having to do with absorption and imaginative involvement (e.g., "Sometimes I cannot remember whether I have done something or have just thought about doing that thing...."); | |
| Factor 2 tapped experiences of depersonalization and derealization (e.g., "Sometimes I have looked in a mirror and not recognized myself"); | |
| Factor 3 involved instances of blackout (e.g., "I have found new things among my belongings that I do not remember buying"); | |
| Factor 4 had to do with transcendence of normal voluntary capacity (e.g., "I am able to ignore pain"); | |
| Factor 5 also involved fairly profound lapses of memory (e.g., "Sometimes I have been driving a car and suddenly realized that I didn't remember what had happened during all or part of the trip"). |
Table 1Factor Analysis,Dissociative Experiences Scale |
|||||
| Factor and DES Item | Factor | ||||
| 1 | 2 | 3 | 4 | 5 | |
|
Absorption |
|||||
| 15. Happening vs. dreaming. | 692 | ||||
| 24. Doing vs. thinking. | 684 | ||||
| 18. Fantasies real. | 615 | 407 | |||
| 20. Staring into space. | 588 | ||||
| 17. Absorption. |
578 |
||||
| 14. Vivid memory. | 573 | 281 | |||
| 02. Listening but not hearing. | 560 | ||||
| 21. Talking when alone. | 504 |
260 |
|||
| 10. Accused of lying. | 450 | 365 | |||
| 22. Act differently. | 477 | 441 | |||
|
Depersonalization/Derealization |
|||||
| 28. World through a fog. | 694 | ||||
| 11. Not recognizing self. | 687 | ||||
| 13. Body doesn't belong to self. | 645 | ||||
|
12. Others not real. |
301 |
614 |
|||
| 07. Observe self from outside. |
597 |
||||
| 27. Hear voices. | 323 | 529 | |||
| 16. Familiar place strange. | 350 | 499 | |||
|
Blackout |
|||||
| 05. Find new things. | 747 | ||||
| 26. Find writings. | 308 | 561 | |||
|
25. Find evidence. |
419 |
551 |
|||
| 04. Find self dressed. | 286 | 543 | 347 | ||
| 03. Find self in a place. | 538 | 350 | |||
| 08. Don't recognize friends. | 496 | ||||
| 06. Known by strangers. | 459 | -368 | |||
|
Transcendence |
|||||
| 19. Ignore pain. |
871 |
||||
| 23. Do difficult things. | 413 | 532 | |||
|
Memory Lapse |
|
||||
|
01. Unaware while driving. |
390 | 593 | |||
| 09. Forget important events. | 495 | ||||
| Note. Decimals omitted. Loadings < .25 are not shown. | |||||
When these factors were subjected to oblique rotation using the oblimin method, the correlations among them were surprisingly low, -.03 < r .47. In particular, Factor 5 was virtually independent of the others, -.03 < r < .11.
Other investigators, usually employing somewhat smaller samples, have obtained a three-factor solution to the structure of the DES (Carlson & Putnam, 1988; Carlson & Putnam, 1990; Carlson, Putnam, Ross, Anderson, Clark, Torem, Coons, Bowman, Chu, Dill, Loewenstein, & Braun, 1991; Ross, Joshi, & Currie, 1991; but see Fischer & Elnitsky, 1990; Fischer, 1990; Schwartz, Frischholz, Braun, & Sachs, 1991). The largest of these, involving a heterogeneous sample 1,574 neurological and psychiatric patients and normals, obtained factors of amnestic dissociation, absorption and imaginative involvement, and depersonalization and derealization (Carlson et al., 1991). Accordingly, a confirmatory principal components analysis (orthogonal varimax rotation) was carried out on the present data set, extracting only three factors: these corresponded closely to those obtained by Carlson et al.; oblique oblimin rotation showed that the three factors were only moderately intercorrelated:
| absorption vs. depersonalization, r = .50; | |
| absorption vs. dissociation, r = .36; | |
| depersonalization vs. dissociation, r = .30. |
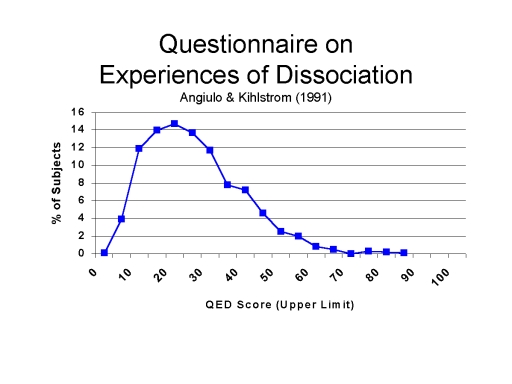 The mean QED percentage score was 23.03 (SD = 13.32), with a median of
20.77. Figure 1B shows the frequency distribution of scores, which is sharply
skewed toward the low end of the continuum. Salient cutpoints were: 80th
percentile, 33.46; 90th percentile, 41.15; 95th percentile, 47.69; and 99th
percentile, 61.92. The reliability of the scale was .91.
The mean QED percentage score was 23.03 (SD = 13.32), with a median of
20.77. Figure 1B shows the frequency distribution of scores, which is sharply
skewed toward the low end of the continuum. Salient cutpoints were: 80th
percentile, 33.46; 90th percentile, 41.15; 95th percentile, 47.69; and 99th
percentile, 61.92. The reliability of the scale was .91.
An exploratory principal-components analysis yielded four factors accounting for 48.4% of the variance (see Table 2). These factors were subjected to varimax rotation:
| Factor 1 included items involving forms of blackout and disorientation (e.g., "My mind has gone blank on me"); | |
| Factor 2 tapped experiences of depersonalization and derealization (e.g., "I often wonder who I really am"); | |
| Factor 3 involved daydreaming and fantasy (e.g., "I daydream often"); | |
| Factor 4 involved trance-like states ("I have sometimes gone into a trance, like hypnosis"). |
When these factors were subjected to oblique rotation using the oblimin method, the correlations among them were positive but modest, .20 < r < .49.
Table 2Factor Analysis,Questionnaire of Experiences of Dissociation |
||||
| QED Item | Factor | |||
| 1 | 2 | 3 | 4 | |
|
Blackout/Disorientation |
|
|||
| 18. Mind goes blank. | 711 | 260 | ||
| 03. Mind goes empty. | 697 | |||
| 16. Understanding others. | 593 | |||
| 10. Disorientation. | 561 | 293 | ||
| 08. Memory lapses. | 560 | |||
| 07. Feel confused. | 559 | 477 | 277 | |
| 09. Forget important events. | 510 | 303 | ||
| 20. Staring into space. | 488 | 447 | ||
| 14. Limbs move on own. | 461 | 346 | ||
| 17. Staring into space. | 430 | 451 | ||
|
Depersonalization/Derealization |
|
|||
| 04. Wonder about identity. | 754 | |||
| 02. Feel like someone else. | 667 | |||
| 05. See self as a stranger. | 640 | |||
| 01. Things not real. | 253 | 632 | ||
| 06. Removed from thoughts. | 382 | 539 | ||
| 13. Someone inside me. | 255 | 383 | 303 | |
|
Fantasy |
|
|||
| 21. Daydreaming. | 780 | |||
| 15. Daydreaming as a child. | 725 | |||
| 19. Rich fantasy life. | 655 | |||
| 11. Of in a world of my own. | 282 | 428 | 310 | |
| 24. Imaginary companions. | 405 | 266 | ||
| 26. Deja vu. | 360 | 311 | ||
|
Trance States |
||||
| 25. Gone into trance. | 257 | 716 | ||
| 23. Hypnotize self. | 712 | |||
| 22. Soul leaves body. | 646 | |||
| 12. Body transformed. | 310 | 488 | ||
| Note. Decimals omitted. Loadings < .25 are not shown. | ||||
Although not intended as a clinical screening instrument, the TAS is designed to sample absorbing and self-altering experiences, including dissociative experiences, in the normal population. The mean TAS percentage score was 30.60 (SD = 15.77), with a median of 28.53. Figure 1C shows the frequency distribution of scores, which has a somewhat more normal distribution than the DES or QED. Salient cutpoints were: 80th percentile, 43.82; 90th percentile, 52.06; 95th percentile, 59.71; and 99th percentile, 73.53. The reliability of the scale was .94.
An exploratory principal-components analysis yielded four factors accounting for 47.6% of the variance (see Table 3). These factors were subjected to varimax rotation: Factor 1 included synesthesia and other items involving absorption in sensory and perceptual experiences (e.g., "Certain pieces of music remind me of pictures or moving patterns of color"); Factor 2 tapped experiences of intuition and insight (e.g., "I often know what someone is going to say before he/she says it"); Factor 3 involved various sorts of imaginative involvements (e.g., "If I wish, I can imagine (or daydream) some things so vividly that they hold my attention as a good movie or story does"); Factor 4 involved various trance states or mystical experiences (e.g., "I sometimes 'step outside' my usual self and experience an entirely different state of being"); and Factor 5 entailed positive emotional involvement in nature and language (e.g., "I can be greatly moved by eloquent or poetic language"). When these factors were subjected to oblique rotation using the oblimin method, the correlations among them were positive but modest, .22 < r < .45. These results are in considerable agreement with the findings of Tellegen (1987; see also Glisky, Tataryn, Tobias, Kihlstrom, & McConkey, 1991; Tellegen, 1981), who obtained six related factors -- responsiveness to engaging stimuli, synesthesia, enhanced cognition, enhanced awareness, vivid reminiscence, and oblivious/dissociative involvement -- in their large sample of college students.
Table 3Factor Analysis,Tellegen Absorption Scale |
|||||
| TAS Item | Factor | ||||
| 1 | 2 | 3 | 4 | 5 | |
|
Sensory/Perceptual Absorption |
|
||||
| 27. Music reminds me of pictures. | 734 | ||||
| 10. Textures remind me of colors. | 656 | ||||
| 33. Odors have colors. | 596 | 290 | |||
| 25. Change noise into music. | 555 | 272 | |||
| 24. Music lifts me into air. | 553 | 285 | |||
| 16. Immersed in nature/art. | 489 | 362 | 289 | ||
| 17. Colors have meanings. | 470 | 394 | |||
| 15. Wood fire/imagination. | 441 | 288 | 373 | ||
| 26. Memory from scents. | 325 | 314 | |||
| 29. Physical memories. |
306 |
305 | |||
|
Intuition |
|
||||
| 28. Know what someone will say. | 697 | ||||
| 14. Sense presence of another. | 655 | 290 | |||
| 31. Feel presence of another. | 601 | 328 | |||
| 19. Vivid recollections. | 575 | 451 | |||
| 32. Unbidden thoughts/images. | 333 | 529 | 325 | ||
| 20. Meaningless things make sense. | 528 | 370 | |||
| 30. Fascinated with voice | 322 | 435 | 270 | ||
|
maginative Involvement |
|||||
| 07. Vivid imagination. | 621 | ||||
| 03. Involved in movie. | 596 | 403 | |||
| 21. Feel emotions while acting. | 365 | 269 | |||
| 04. Afterimages. | 485 | ||||
| 12. Caught up in music. | 304 | 431 | 255 | ||
| 18. Wander into thoughts. | 362 | 483 | |||
| 22. Thoughts as images. | 340 | 361 | 451 | ||
|
Trance |
|||||
| 09. Step outside myself. | 681 | ||||
| 05. Mind envelops the world. | 261 | 624 | |||
| 08. Mystical experiences. | 296 | 607 | 254 | ||
| 11. Things doubly real. | 299 | 298 | 487 | ||
| 13. Imagine body is heavy. | 348 | 498 | |||
|
Nature and Language |
|
||||
| 02. Moved by language. | 685 | ||||
| 34. Moved by sunset. | 316 | 322 | 645 | ||
| 06. Cloud shapes change. | 590 | ||||
| 23. Delight in small things. | 413 | 364 | 457 | ||
| 01. Childlike experience. | 321 | 302 | 361 | ||
| Note. Decimals omitted. Loadings < .25 are not shown. | |||||
In view of the frequent observation of sex differences in the incidence of MPD, the three scales were analyzed for sex differences (a few subjects had to be omitted from this analysis because of their failure to indicate their gender). Although women scored higher than men on all three scales, the differences were not significant on either DES, t(1363) = 1.44, or QED, t(1331) = 1.25; for TAS, however, the difference was statistically significant, t(1304) = 3.26, p < .005.
The three scales included in this study were highly intercorrelated (a total of 1,245 subjects provided data on all three scales):
| TAS vs. DES, r = .83; | |
| TAS vs. QED, r = .80; | |
| DES vs. QED, r = .91. |
Of course, these high correlations could be carried by the high degree of content overlap: although the TAS has few items relating to pathological dissociation, the DES and QED have many items pertaining to absorption and imaginative involvement.
In order to obtain a measure of categorical agreement in the assessment of dissociative tendencies, the DES and QED distributions were divided into deciles. Table 4 shows the resulting contingency table for those 1,308 subjects who had scores on both scales: the relationship between the two classifications is obviously significant, X2(81) = 2312.67, p < .0001. If the top 10% of the distribution (DES cutoff, 11.23; QED cutoff, 10.65) is assumed to contain those who are at risk for dissociative disorder, then there is a fair amount of agreement between the two procedures. A total of 90 subjects placed in the 10th deciles of both the DES and QED distributions, representing 69.23% of those with top scores on DES, and 67.16% those with top scores on the QED. Thus, there was a 93.6% agreement on the classification of subjects. When the cutoff was moved to the 95th percentile, agreement increased to 96.56%; when the criterion was moved to the 99th percentile, agreement increased again, to 99.31%.
Table 4Correspondence Between DES and QED Deciles
|
|||||||||||
| QED Decile |
DES Decile |
||||||||||
| 1 | 2 | 3 | 4 | 5 | 6 | 7 | 8 | 9 | 10 | Total | |
| 1 |
82 |
27 | 6 | 6 | 0 | 1 | 0 | 0 | 0 | 0 | 122 |
| 2 | 31 | 54 | 25 | 11 | 4 | 1 | 0 | 0 | 0 | 0 | 126 |
| 3 | 9 | 29 | 39 | 35 | 17 | 6 | 0 | 0 | 0 | 0 | 135 |
| 4 | 2 | 19 | 20 | 41 | 28 | 17 | 3 | 3 | 0 | 0 | 133 |
| 5 | 0 | 5 | 11 | 30 | 31 | 35 | 18 | 6 | 1 | 0 | 137 |
| 6 | 0 | 3 | 10 | 11 | 25 | 29 | 34 | 9 | 6 | 0 | 127 |
| 7 | 0 | 0 | 4 | 7 | 14 | 17 | 39 | 26 | 20 | 1 | 128 |
| 8 | 0 | 0 | 0 | 5 | 9 | 21 | 25 | 41 | 28 | 6 | 135 |
| 9 | 0 | 0 | 0 | 1 | 0 | 6 | 10 | 37 | 46 | 32 | 132 |
| 10 | 0 | 0 | 0 | 0 | 0 | 0 | 4 | 7 | 32 | 90 | 133 |
| Total | 124 | 137 | 115 | 147 | 128 | 133 | 133 | 129 | 133 | 129 | 1308 |
In an attempt to further examine the relationships among the scales, an exploratory principal-components analysis of the 88 questionnaire items yielded 16 factors accounting for 55.8% of the variance. Many factors had only a few items with substantial loadings, and many items failed to show substantial loadings on any factors. In order to reduce the number of factors to manageable size, the analysis was repeated on the 14 subscales (five each from DES and TAS, four from QED) derived from the factor analyses described above, using unit weightings to aggregate items into subscales.
The analysis yielded two factors accounting for 64.6% of the variance (Table 5). Factor 1, labelled absorption, consisted of all five TAS subscales, the DES subscales for absorption and trancelike states, and the QED subscales for fantasy and trancelike states. Factor 2, labelled dissociation, consisted of the DES subscales for blackout, memory lapse, and depersonalization/derealization, and the QED subscales for blackout/disorientation and depersonalization/derealization. Oblique (oblimin) rotation showed that these two factors were highly correlated, r = .56.
Table 5Factor Analysis,Subscales of DES, QED, and TAS |
||
|
Instrument and Subscale |
Factor |
|
|
1 |
2 |
|
|
Absorption |
||
| TAS Sensation/Perception | 842 | |
| TAS Intuition | 787 | 393 |
| TAS Imagination | 726 | 407 |
| TAS Nature/Language | 711 | |
| QED Fantasy | 688 | 425 |
| DES Transcendence | 653 | |
| DES Absorption | 641 | 604 |
| QED Trance | 618 | 360 |
| TAS Trance | 605 | 518 |
|
Dissociation |
||
| QED Blackout/Dissociation | 416 | 744 |
| QED Depersonalization/Derealization | 392 | 736 |
| DES Blackout | 308 | 717 |
| DES Memory Lapses | 714 | |
| DES Depersonalization/Derealization | 555 | 634 |
| Note. Decimals omitted. Loadings
< .25 are not shown.
DES = Dissociative Experiences Scale; TAS = Tellegen Absorption Scale; QED = Questionnaire of Experiences of Dissociation. |
||
While the dissociative spectrum includes a wide variety of absorptions and imaginative involvements that occur in the ordinary course of everyday living, blackouts, memory lapses, depersonalization, and derealization seem to come closest to the symptoms of dissociative disorder per se. Accordingly, the items most representative of these factors -- what might be considered "critical items" -- were selected for closer examination.
Table 6 shows the results, in terms of the frequency with which each critical item was endorsed (i.e., incidence: any rating > 0% of the time), and the frequency with which the corresponding experience was reported, in those subjects in whom it occurred at all. Thus, a total of 44.9% of subjects reported at least one episode where they failed to recognize friends (DES Item #08); and for these subjects, the mean frequency with which that experience occurred was 25.14% of the time. Similarly, 28.5% of subjects reported at least one experience where they found new things among their belongings that they did not remember buying; and for these subjects, the mean frequency with which that experience occurred was 19.54% of the time.
Table 6Incidence and Frequency of Critical Itemson the DES and QED |
|||
| Instrument and Item | % | M | SD |
|
DES DISSOCIATION SUBSCALES Depersonalization/Derealization |
|||
|
28. World through a fog. |
44.9 | 25.14 | 21.52 |
|
11. Not recognizing self. |
30.2 | 23.09 | 20.95 |
|
13. Body doesn't belong to self. |
36.4 | 27.12 | 23.15 |
|
12. Others not real. |
61.7 | 27.39 | 23.28 |
|
07. Observe self from outside. |
45.2 | 26.47 | 21.82 |
|
27. Hear voices. |
57.9 | 36.27 | 28.18 |
| 16. Familiar place strange. | 72.5 | 31.97 | 23.03 |
|
Blackout |
|||
|
05. Find new things. |
28.5 | 19.54 | 17.58 |
| 26. Find writings. | 48.8 | 27.63 | 23.60 |
| 25. Find evidence. | 64.5 | 25.60 | 21.06 |
| 04. Find self dressed. | 16.5 | 17.63 | 14.38 |
| 03. Find self in a place. | 38.6 | 19.60 | 16.13 |
| 08. Don't recognize friends. | 21.4 | 20.73 | 18.72 |
| 06. Known by strangers. | 60.2 | 29.87 | 28.86 |
|
Memory Lapse |
|||
| 01. Unaware while driving. | 82.2 | 41.18 | 25.54 |
| 09. Forget important events. | 32.3 | 24.27 | 21.92 |
|
QED DISSOCIATION SUSCALES Blackout/Disorientation |
|||
| 18. Mind goes blank. | 82.0 | 32.23 | 23.98 |
| 03. Mind goes empty. | 83.5 | 30.45 | 22.79 |
| 16. Understanding others. | 74.0 | 25.40 | 20.34 |
| 10. Disorientation. | 41.1 | 20.75 | 17.51 |
| 08. Memory lapses. | 53.7 | 25.73 | 21.10 |
| 07. Feel confused. | 89.3 | 34.34 | 24.00 |
| 09. Forget important events. | 84.1 | 28.95 | 23.52 |
|
20. Staring into space. |
84.3 | 35.74 | 24.62 |
|
14. Limbs move on own. |
48.4 | 25.29 | 22.04 |
|
17. Staring into space. |
95.2 | 50.20 | 30.22 |
|
Depersonalization/Derealization |
|||
| 04. Wonder about identity. | 73.5 | 38.77 | 28.36 |
| 02. Feel like someone else. | 58.6 | 24.77 | 20.25 |
| 05. See self as a stranger. | 55.3 | 27.80 | 23.54 |
| 01. Things not real. | 83.9 | 32.08 | 24.04 |
| 06. Removed from thoughts. | 68.4 | 25.08 | 20.95 |
| 13. Someone inside me. | 47.6 | 32.62 | 26.73 |
As expected, the relations among the DES, QED, and TAS were very strong. In particular, it appears that the DES and QED can substitute for each other, as Riley (1988) had hoped. The correlation between these two measures, r = .91, is approximately the same as their internal consistency. Moreover, the two scales are approximately equal in difficulty level, in that the mean frequency of dissociative experiences reported on the two measures is approximately the same, 22-23% of the time. Thus, as Riley (1988) intended, the two scales would appear to be interchangeable. The DES and QED were both highly correlated with the TAS as well; the DES-TAS results confirm the findings of other studies (Lewis, Frischholz, Braun, & Sachs, 1991; Nadon, Hoyt, Register, & Kihlstrom, 1991).1
While the internal structure of the QED has not previously been analyzed, the results with the DES are largely congruent with those obtained by other investigators. Thus, as noted, Carlson and Putnam obtained evidence for three factors: amnestic dissociation, derealization and depersonalization, and absorption and imaginative involvement. Ross, Joshi, and Currie (1991), reanalyzing data collected in a random population sample, confirmed these results. So did Carlson and her colleagues in a large mixed sample of patients and normals (Carlson, Putnam, Ross, Anderson, Clark, Torem, Coons, Bowman, Chu, Dill, Loewenstein, & Braun, 1991). Although our exploratory analysis yielded evidence for five factors, two of these (transcendance and memory lapse) were doubletons, and one of these (memory lapse) was conceptually related to one of the three large factors (blackout). When we restricted the analysis to a three-factor solution, we confirmed the findings of these other investigators.
Recently, Fischer and Elnitsky (1990), analyzing data collected from college students, reported that the DES appeared to be comprised of only a single factor, and suggested that this instrument did not adequately measure the various components of dissociative experience. Moreover, in a joint analysis of the DES and the PAS the constituent items of these two scales loaded on two different (correlated) factors, suggesting that there were major differences between them. In reply, Carlson and Putnam (1990) suggested that Fisher and Elnitsky's findings may have been an artifact of their use of 10-point Likert-type scales rather than a 10-cm visual analogue scale; or that different factor structures might underlie the responses of normals and patients. And, in fact, Schwartz et al. 1991) have obtained some evidence of different factor structures in two small samples of dissociative disorder patients and normals. However, the present results obtained solid evidence for three factors from college students responding to 11-point Likert-type scales. Moreover, a four-factor structure was extracted from the similar QED.
The finding of Fischer and Elnitsky (1990), that the items of DES and PAS lined up on different factors, is probably an artifact of method variance: the DES was administered in its original format, with 10-cm visual analogue scales, while the PAS was administered in its quite different original format, involving 4-point Likert-type scales. However, the present study does provide some support for their claim that the DES is dominated by a single dimension of absorption. As Table 1 indicates, the first factor extracted was absorption: this was by far the strongest factor, with an eigenvalue of 8.53, accounting for 30.48% of total variance, and 62.39% of the factor space; the remaining four factors all had eigenvalues less than 1.57, and accounted for only an additional 18.37% of total variance, and an additional 37.61% of the factor space. Thus, while a three-factor structure is reliable across populations and scaling methods, there is also considerable support for a single-factor structure reflecting absorption, rather than dissociation.2
The factor-analytic findings underscore the point that the DES and QED both contain many items tapping normal experiences of absorption, imaginative involvement, and nonpathological depersonalization and derealization in addition to items related to more clearly pathological experiences of dissociation. While a proneness to such experiences may well predispose individuals to develop dissociative psychopathology under stress, this hypothesis has not been specifically tested. In this respect, it should be noted that the DES contains proportionately more items indicative of the sorts of memory lapses that are pathognomic of dissociative disorder, compared to the QED; moreover, the QED contains some items pertaining to the transcendence of normal voluntary capacity, which are also of uncertain relevance to dissociation.
If the intent of the investigator is to identify individuals who have actually experienced episodes of dissociative psychopathology, the DES may be the preferred instrument. Even so, the inclusion in the DES of so many items pertaining to relatively normal episodes of absorption means that some high-scoring subjects may have had no pathological dissociative experiences at all. Accordingly, for purposes of large-scale epidemiological studies, it seems desirable to develop an instrument that assesses the symptoms of pathological dissociation directly, uncontaminated by experiences of normal dissociation and absorption. In view of the strong links between the dissociative disorders and the conversion disorders (Kihlstrom, 1991; Kihlstrom, Tataryn, & Hoyt, 1990; Nemiah, 1991), it may be desirable to include items relating to dissociative anesthesias (e.g., blindness, deafness, analgesia, etc.) and paralyses (e.g., immobility and weakness of the limps, aphonia, astasia-abasia) as well.
For the present, however, in terms of the sheer amount of accumulated literature, the DES appears to be the instrument of current choice for assessing dissociative tendencies and identifying individuals at risk for dissociative disorder. Accordingly, it makes sense to ask what cutpoints might be used for this purpose. In the first publication on the DES, Bernstein and Putnam (1986) reported a median score for a group 31 college students of 4.38; a group of 10 patients with PTSD showed a median score of 31.25, while 20 patients with MPD yielded a median score of 57.06. Ross and his colleagues, analyzing data from a random sample (N = 1,055) of the population of Winnepeg, reported a mean score of 10.8, and a median score of 7.0 (Ross, Joshi, & Currie, 1990); a sample of 182 Canadian adolescents and college students yielded a mean score of 17.7 for the former and of 7.9 for the latter (Ross et al., 1988); and a sample of 82 MPD patients had a mean score of 41.1 (Ross, Miller, Reagor, Bjornson, Fraser, & Anderson, 1990; see also Ross, Norton, & Anderson, 1988). Ensink and van Otterloo (1989) reported a median score of 16.3 for Dutch college students. And finally, Frischholz and his colleagues reported mean scores of 23.8 (median = 22.9) in a sample of 259 United States college students, 40.8 (44.8) for 29 patients diagnosed with dissociative disorder not otherwise specified, and 55.0 (53.9) for 33 MPD patients (Frischholz et al., 1990). In the most recent study, Steinberg and her colleagues found mean values of 2.33 for adult normals, 9.43 for psychiatric patients without dissociative disorder, and 37.15 for patients with dissociative disorder (Steinberg et al., 1991). When DES self-report scores were compared to the results of the clinician-administered SCID-D, DES cutoffs of 15 and 20, respectively, yielded sensitivity values of .95 and .90, and specificity values of 1.00 and 1.00, for a small sample (N = 9) nonpatients; and sensitivity values of .95 and .90, and specificity values of .93 and .93, for a larger sample of 36 mixed psychiatric patients.
In the present sample, 336 of the subjects (23.0%) received a percentage score equal to or higher than the median of the PTSD patients studied by Bernstein and Putnam (1986), while only 14 subjects (slightly less than 1.0%) received a percentage score equal to or higher than the median of the MPD patients. However, fully 66% of our student sample had DES scores greater than 15, and 53% had scores greater than 20. Given the high frequency with which experiences of absorption and imaginative involvement are reported by college students, it is likely that higher cutpoints will be required for identifying individuals at risk within this population. If DES values of 50 or greater are taken as indicating a high risk for developing dissociative disorder among college students, then all studies seem to agree that such scores are obtained by no more than about 1% of subjects in the general population.
This research was supported in part by Grant #MH-35856 from the National Institute of Mental Health. We thank Terrence Barnhardt, Lawrence Couture, Martha Glisky, Lori Marchese, Susan McGovern, Robin Pennington, Sheila Mulvaney, Claudette Sandell, Victor Shames, Douglas Tataryn, and Irene Tobis for their comments.
1Other screening instruments have also been offered by various investigators: the Perceptual Alterations Scale (PAS; Sanders, 1986), and the Dissociative Symptom Screening Inventory (DSSI; Steinberg, 1990). The PAS correlates highly with the PAS (Lewis, Frischholz, Braun, & Sachs, 1991; Nadon et al. 1991). On the other hand, the PAS contains many items dealing with eating disorders, which are of uncertain relevance to the diagnosis of dissociation. The relations between the DDSI and the other questionniares have not been documented. Return to text.
2In the QED, the first factor was also quite strong, with an eigenvalue of 8.09, accounting for 31.13% of the total variance and 65.50% of the factor space, compared to eigenvalues of less than 1.69 for the remaining factors. However, the first factor extracted was more clearly a dissociation factor. Return to text.
Bernstein, E.M., & Putnam, F.W. (1986). Development, reliability, and validity of a dissociation scale. Journal of Nervous & Mental Disease, 174, 727-735.
Carlson, E.B., & Putnam, F.W. (1988). Further validation of the Dissociative Experiences Scale. Paper presented at the annual meeting of the American Psychological Association, 1988.
Carlson, E.B., & Putnam, F.W. (1990). Comment on 'A factor analytic study of two scales measuring dissociation' by Fischer and Elnitsky. American Journal of Clinical Hypnosis, 33, 133-134.
Carlson, E.B., Putnam, F.W., Ross, C., Anderson, G., Clark, P., Torem, M., Coons, P., Bowman, E.S., Chu, J.A., Dill, D.L., Loewenstein, R.J., & Braun, B.G. (1991, November). A factor analysis of the Dissociative Experiences Scale using multicenter study data. Paper presented at the 8th International Conference on Multiple Personality/Dissociative States, Chicago.
Endicott, J., & Spitzer, R.L. (1978). A diagnostic interview: The Schedule for Affective Disorders and Schizophrenia. Archives of General Psychiatry, 35, 837-844.
Ensink, B.J., & van Otterloo, D. (1989). A validation study of the Dissociative Experiences Scale in the Netherlands. Dissociation, 2, 221-223.
Fischer, D.G. (1990). Reply to Carlson and Putnam letter. American Journal of Clinical Hypnosis, 33, 134-135.
Fischer, D.G., & Elnitsky, S. (1990). A factor analytic study of two scales measuring dissociation. American Journal of Clinical Hypnosis, 32, 201-207.
Frischholz, E.J., Braun, B.G., Sachs, R.G., Hopkins, L., Shaeffer, D., Lewis, J., Leavitt, F., Pasquotto, J.N., & Schwartz, D.R. (1990). The Dissociative Experiences Scale: Further replication and validation. Dissociation, 3, 151-153.
Glisky, M.L., Tataryn, D.J., Tobias, B.A., Kihlstrom, J.F., & McConkey, K.M. (1991). Absorption, openness to experience, and hypnotizability. Journal of Personality & Social Psychology, 60, 263-272.
Kihlstrom, J.F. (1991). Dissociative and conversion disorders. In D.J. Stein & J. Young (Eds.), Cognitive science and clinical disorders (in press). San Diego: Academic.
Kihlstrom, J.F., Tataryn, D.J., & Hoyt, I.P. (1990). Dissociative disorders. In P.J. Sutker & H.E. Adams (Eds.), Comprehensive handbook of psychopathology, 2nd Ed (in press). New York: Plenum.
Lewis, J., Frischholz, E.J., Braun, B.G., & Sachs, R.G. (1991, November). The relation between the Dissociative Experiences Scale (DES) and other self-report measures of dissociation. Paper presented at the 8th International Conference on Multiple Personality/Dissociative States, Chicago.
Nadon, R., Hoyt, I.P., Register, P.A., & Kihlstrom, J.F. (1991). Absorption and hypnotizability: Context effects re-examined. Journal of Personality & Social Psychology, 60, 144-153.
Nemiah, J.C. (1991). Dissociation, conversion, and somatization. In D. Spiegel (Ed.), Dissociative disorders. American Psychiatric Press Review of Psychiatry, 10, 248-275.
Nunnally, J.C. (1978). Psychometric theory. 2nd ed. New York: McGraw-Hill.
Riley, K.C. (1988). Measurement of dissociation. Journal of Nervous & Mental Disease, 176, 449-450.
Robins, L.N., Helzer, J.E., Croughan, J., & Ratcliff, K.S. (1981). National Institute of Mental Health diagnostic interview schedule: Its history, characteristics, and validity. Archives of General Psychiatry, 38, 381-389.
Ross, C.A., Heber, S., Norton, G.R., Anderson, D., Anderson, G., & Barchet, P. (1989). The Dissociative Disorders Interview Schedule: A structured interview. Dissociation, 2, 169-189.
Ross, C.A., Joshi, S., & Currie, R. (1990). Dissociative experiences in the general population. American Journal of Psychiatry, 147, 1547-1552.
Ross, C.A., Joshi, S., & Currie, R. (1991). Dissociative experiences in the general population: A factor analysis. Hospital & Community Psychiatry, 42, 297-301.
Ross, C.A., Miller, D.S., Reagor, P., Bjornson, L., Fraser, G.A., & Anderson, G. (1991). Structured interview: Data on 102 cases of multiple personality disorder from four centers. American Journal of Psychiatry, 147, 596-601.
Ross, C.A., Norton, G.R., & Anderson, G. (1988). The Dissociative Experiences Scale: A replication study. Dissociation, 1, 21-22.
Ross, C.A., Ryan, L., Anderson, G., Ross, D., & Hardy, L. (1989). Dissociative experiences in adolescents and college students. Dissociation, 2, 239-242.
Sanders, S. (1986). The Perceptual Alteration Scale: A scale measuring dissociation. American Journal of Clinical Hypnosis, 29, 95-102.
Schwartz, D.R., Frischholz, E.J., Braun, B.G., & Sachs, R.G. (1991, November). A confirmatory factor analytic study of the Dissociative Experiences Scale (DES). Paper presented at the 8th International Conference on Multiple Personality/Dissociative States, Chicago.
Spitzer, R.L., Williams, J.B.W., Gibbon, M., & First, M.B. (1990). User's guide for the Structured Clinical Interview for DSM-III-R. Washington, D.C.: American Psychiatric Press.
Steinberg, M., Rounsaville, B., & Cicchetti, D. (1990). The Structured Clinical Interview for DSM-III-R Dissociative Disorders: Preliminary report on a new diagnostic instrument. American Journal of Psychiatry, 147, 76-82.
Steinberg, M., Rounsaville, B., & Cicchetti, D. (1991). Detection of dissociative disorders in psychiatric patients by a screening instrument and a structured diagnostic interview. American Journal of Psychiatry, 148, 1050-1054.
Tellegen, A. (1981). Practicing the two disciplines for relaxation and enlightenment: Comment on "Role of the feedback signal in electromyograph biofeedback: The relevance of attention" by Qualls and Sheehan. Journal of Experimental Psychology: General, 110, 217-226.
Tellegen, A. (1987, October). Discussion: Hypnosis and absorption. Paper presented at the annual meeting of the Society for Clinical and Experimental Hypnosis, Los Angeles.
Tellegen, A., & Atkinson, G. (1974). Openness to absorbing and self-altering experiences ("absorption"), a trait related to hypnotic susceptibility. Journal of Personality & Social Psychology, 83, 268-277.
This page last modified 04/08/10 02:58:37 PM.